Douglas is a Democratic stronghold. About 77% of voters here vote Democratic and 23% Republican. These figures are model estimates: Alaska did not have precinct-level voting records available for training, so the numbers above come from demographic and health features rather than local ground truth.
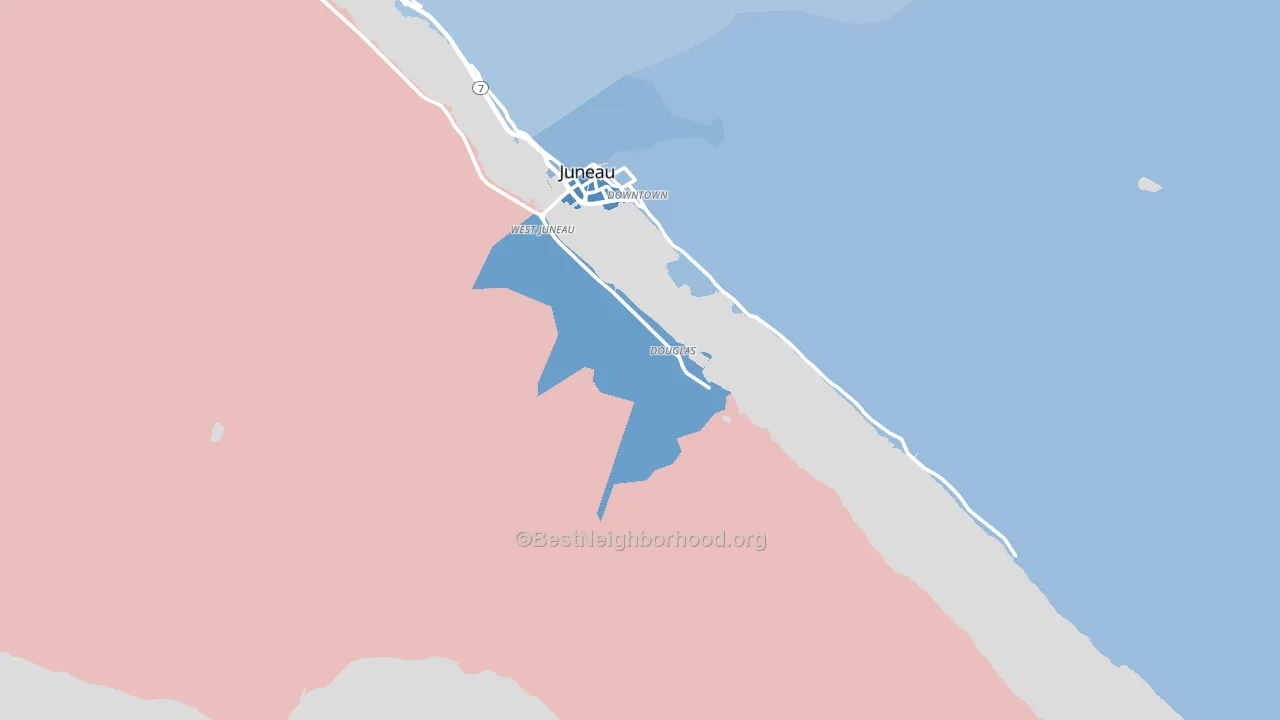
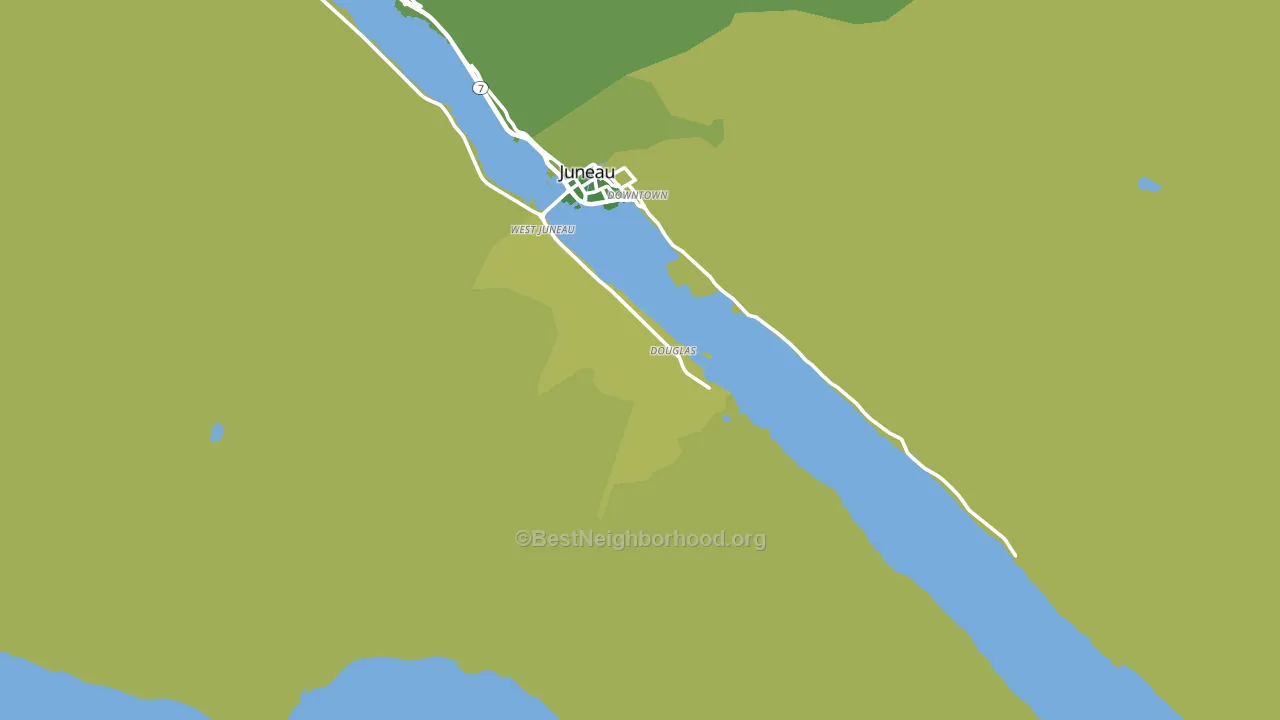
About 64% of adults in Douglas typically vote, near the U.S. average of about 62%. Among adults in Douglas, ~49% vote Democratic, ~15% Republican, and ~36% don't vote. The map below shows estimated turnout by block group.
How Douglas compares
Among cities within 25 miles, Douglas is the most Democratic-leaning.
Douglas runs about 67 points more Democratic than Alaska as a whole. Alaska leans Republican overall, while Douglas is one of the few Democratic-leaning pockets.
Why Douglas leans the way it does
This analysis examined 14,881 data points per city to find what predicts political lean and turnout. The items below are a few correlations that stood out for Douglas, not a ranked or complete list of what matters most.
Areas with high college attainment vote Democratic. About 50% of adults in Douglas hold a bachelor's degree, about 21 points above the U.S. average of 28%. A high never-married share predicts Democratic voting, and about 41% of adults in Douglas have never been married, above 94% of cities. Douglas runs against the grain of Alaska, a Democratic-leaning pocket in a Republican-leaning state.
Preventive-care access and voter turnout
Places with strong routine preventive-care access tend to turn out at a higher rate; Douglas, AK sits above the national average on this measure. Dental visits do not drive turnout; the rate reflects income, insurance, and healthcare access, which line up with who votes.
Why turnout in Douglas looks the way it does
Areas with high high-school completion turn out at higher rates. About 96% of adults in Douglas have completed high school, about 7 points above the Alaska average of 89%. Learn more about the findings and methodology on the political spectrum map.
Nearby Cities
- West Juneau, AK D+39
- Thane, AK D+37
- Juneau, AK D+17
- Auke Bay, AK D+14
- Tee Harbor, AK D+12
- Hoonah, AK D+10
- Tenakee Springs, AK D+13
- Gustavus, AK R+18
- Angoon, AK D+15
- Elfin Cove, AK Even
Cities with Similar Populations
- Erie, IL R+46
- Ty Ty, GA R+67
- Hamshire, TX R+72
- Reynolds, GA R+15
- La Plata, MO R+63
- Rye, CO R+36
- Axson, GA R+76
- Grand Forks Afb, ND R+33
- Archie, MO R+60
- Hines, OR R+43
Sources and methodology
Precinct-level voting records used to fit the model come from Alaska Division of Elections, distributed by the Voting and Election Science Team. Demographic inputs come from the U.S. Census Bureau (ACS 5-year estimates and the 2020 Decennial Census). Health and environmental inputs come from the CDC (PLACES and the Environmental Justice Index). Land cover comes from the USGS and EPA. Election-day and lead-up weather come from PRISM 4km daily grids and the NOAA Global Historical Climatology Network. Mail-voting and election-administration patterns come from the MIT Election Lab's Survey of the Performance of American Elections. Block-group crime detail comes from CrimeGrade. Internet data and modeling support provided by ISPreports.org.
Modeling and analysis by the BestNeighborhood data science team. AK did not have precinct-level voting records available for training, so the figures here come from extrapolation across demographic, health, and land-use features rather than local ground truth. Full methodology and findings: political spectrum map.
Methodology reviewed by the BestNeighborhood data team. Last updated May 2026.