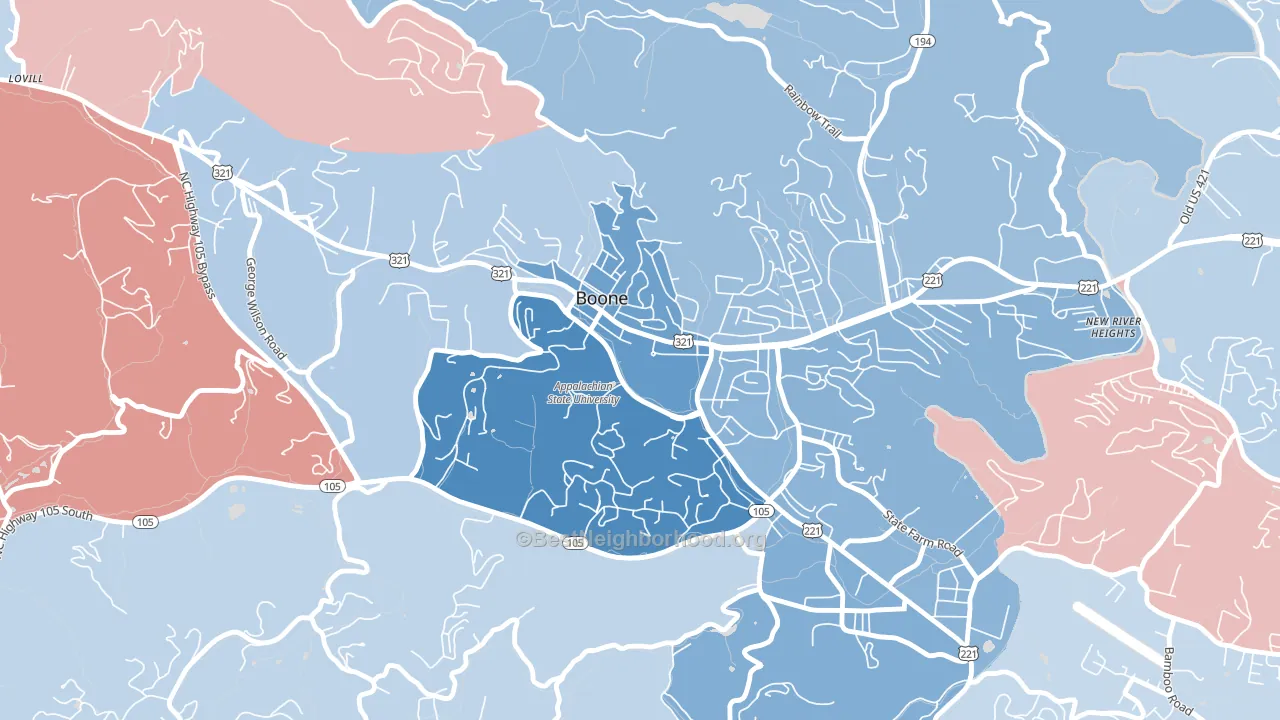
Downtown Boone leans heavily Democratic by roughly 44 points: about 72% of voters vote Democratic and 28% Republican.
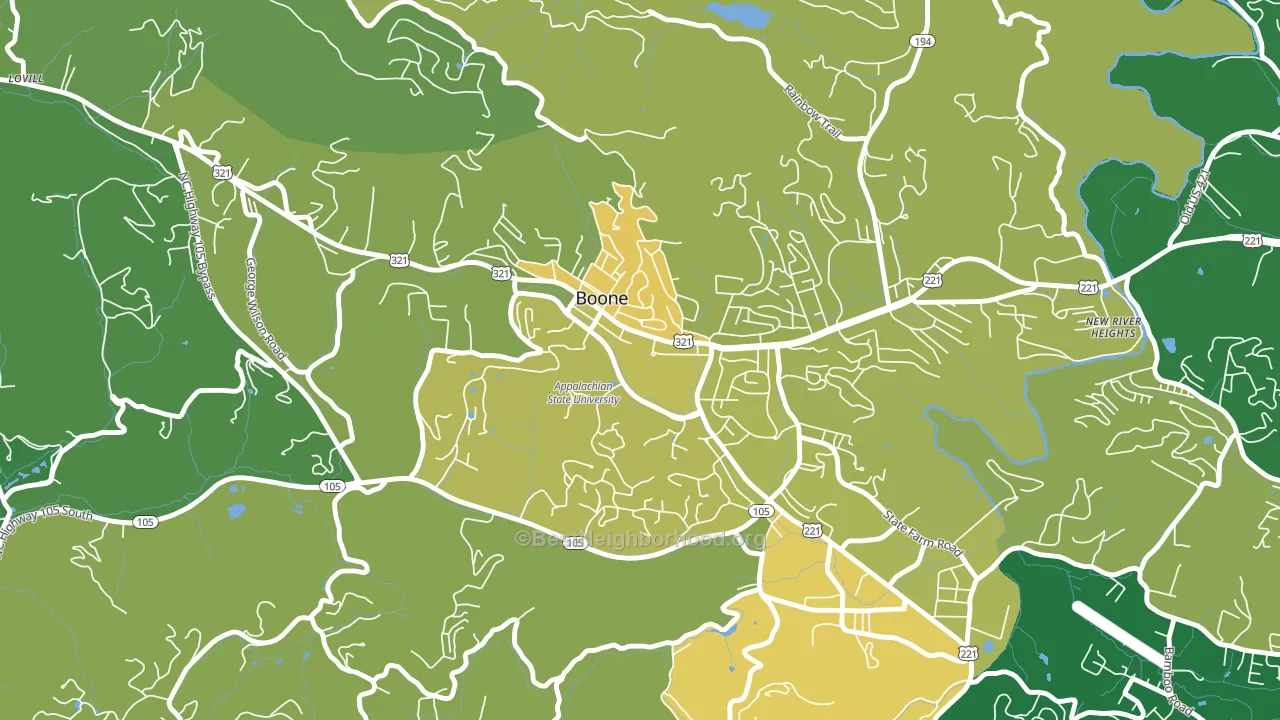
About 56% of adults in Downtown Boone typically vote, below the U.S. average of about 62%. Among adults in Downtown Boone, ~40% vote Democratic, ~16% Republican, and ~44% don't vote. The map below shows estimated turnout by block group.
How Downtown Boone compares
Downtown Boone runs about 48 points more Democratic than North Carolina as a whole. North Carolina leans Republican overall, while Downtown Boone is one of the few Democratic-leaning pockets.
Politics vary noticeably by block within Downtown Boone. The north side is the most Democratic-leaning (D+50) and the northwest side is the least Democratic-leaning (D+36), a spread of about 13 points.
Why Downtown Boone leans the way it does
This analysis examined 14,881 data points per neighborhood to find what predicts political lean and turnout. The items below are a few correlations that stood out for Downtown Boone, not a ranked or complete list of what matters most.
Downtown Boone votes against the grain of North Carolina. North Carolina leans Republican overall, while Downtown Boone runs about 48 points more Democratic. A high never-married share predicts Democratic voting, and about 91% of adults in Downtown Boone have never been married, in the top fraction of neighborhoods.
Homeownership and voter turnout
Places with renter-heavy households tend to turn out at a lower rate; Downtown Boone, Boone, NC sits in the bottom tenth nationally on this measure.
Why turnout in Downtown Boone looks the way it does
Renters vote less often than owners. About 86% of households in Downtown Boone rent, about 61 points above the U.S. average of 25%. Low high-school completion lines up with lower turnout, and about 66% of adults in Downtown Boone have completed high school, below 96% of neighborhoods. Learn more about the findings and methodology on the political spectrum map.
Nearby Neighborhoods
- Douglas, Elizabethton, TN R+46
- Oakley, Asheville, NC D+38
- Historic Montford, Asheville, NC D+72
- Harwood Lane, Charlotte, NC D+37
- Coulwood West, Charlotte, NC D+42
- Skybrook, Huntersville, NC D+7
- Wedgewood, Charlotte, NC D+66
- Wildwood, Charlotte, NC D+51
- Davis Lake-Eastfield, Charlotte, NC D+50
- Oakdale South, Charlotte, NC D+60
Neighborhoods with Similar Populations
- Woodridge Lakes, Mesa, AZ R+12
- Coral Ridge, Fort Lauderdale, FL R+14
- Muncie-Stony PT., Kansas City, KS Even
- Globe, Woonsocket, RI D+16
- St. Johns, Portland, OR D+48
- Tosa East Towne, Wauwatosa, WI D+52
- Tobin Hill, San Antonio, TX D+40
- Parkdale Viking Hills, Waco, TX R+15
- Sunshine, Lehigh Acres, FL D+6
- Stone Meadows, Bakersfield, CA R+4
Sources and methodology
Precinct-level voting records used to fit the model come from North Carolina State Board of Elections, distributed by the Voting and Election Science Team. Demographic inputs come from the U.S. Census Bureau (ACS 5-year estimates and the 2020 Decennial Census). Health and environmental inputs come from the CDC (PLACES and the Environmental Justice Index). Land cover comes from the USGS and EPA. Election-day and lead-up weather come from PRISM 4km daily grids and the NOAA Global Historical Climatology Network. Mail-voting and election-administration patterns come from the MIT Election Lab's Survey of the Performance of American Elections. Block-group crime detail comes from CrimeGrade. Internet data and modeling support provided by ISPreports.org.
Modeling and analysis by the BestNeighborhood data science team. Full methodology and findings: political spectrum map.
Methodology reviewed by the BestNeighborhood data team. Last updated May 2026.