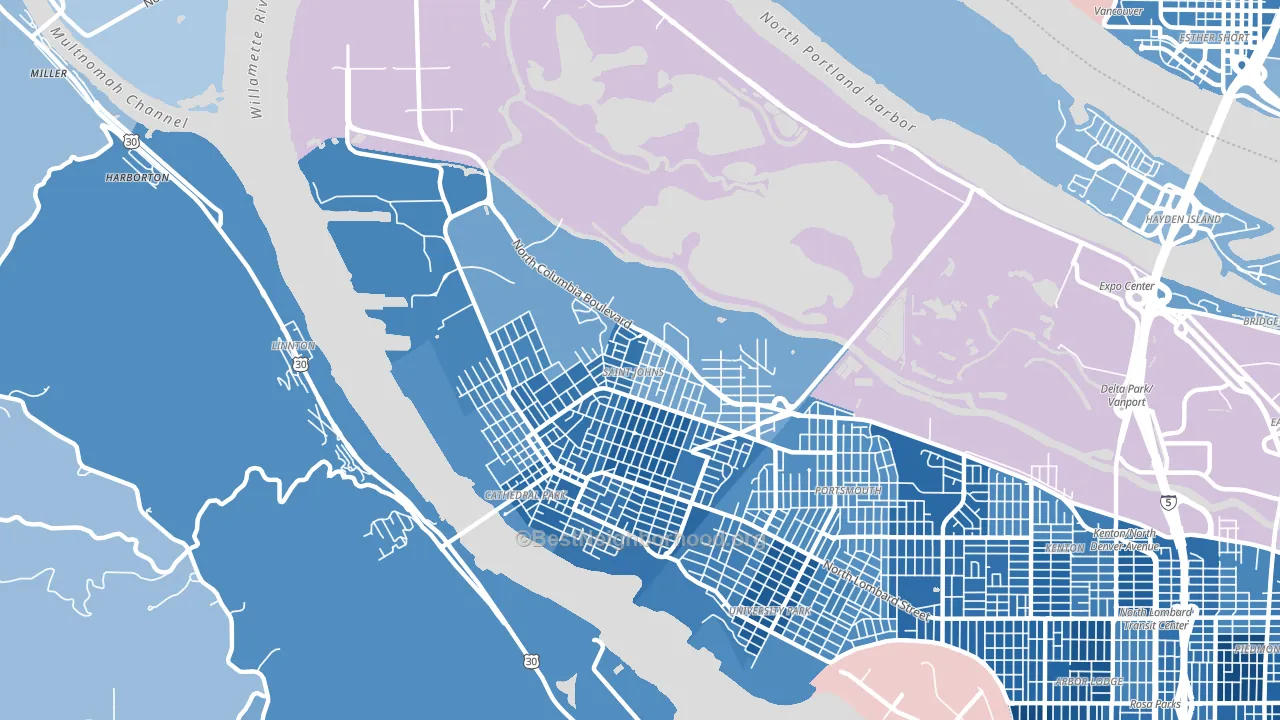
St. Johns leans heavily Democratic by roughly 48 points: about 74% of voters vote Democratic and 26% Republican.
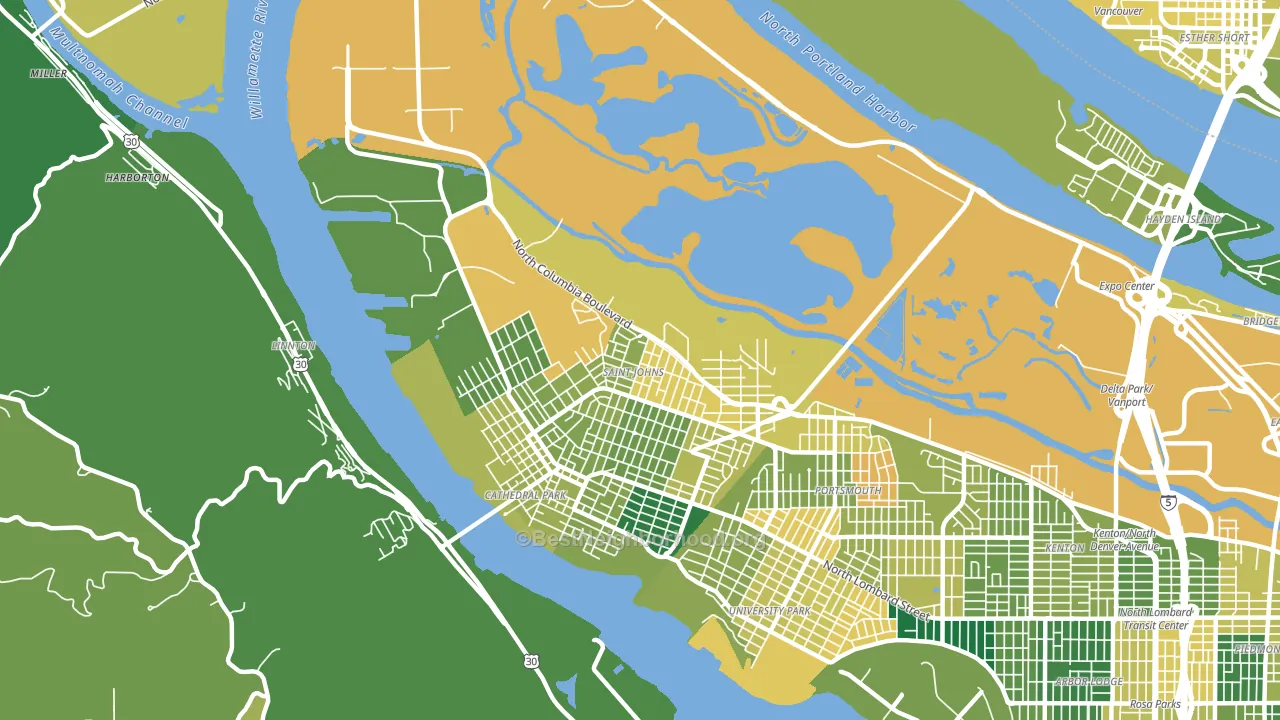
About 58% of adults in St. Johns typically vote, near the U.S. average of about 62%. Among adults in St. Johns, ~43% vote Democratic, ~15% Republican, and ~42% don't vote. The map below shows estimated turnout by block group.
How St. Johns compares
Among neighborhoods within 5 miles, St. Johns leans more Democratic than 3 of 12 neighbors.
St. Johns runs about 34 points more Democratic than Oregon as a whole.
Politics vary noticeably by block within St. Johns. The west side is the most Democratic-leaning (D+51) and the northeast side is the least Democratic-leaning (D+32), a spread of about 19 points.
Why St. Johns leans the way it does
Density, race composition, education, and family structure all sit close to their national averages in St. Johns. The lean here lands roughly where demographic data alone would predict.
Paved land cover and Democratic lean
Places with extensive paved surfaces tend to lean Democratic; St. Johns, Portland, OR sits in the top quarter nationally on this measure. Paved ground does not change how people vote; it mostly reflects how urban and built-up a place is.
Why turnout in St. Johns looks the way it does
Turnout in St. Johns sits close to the national pattern. Routine healthcare access, homeownership, education, and food security all land near their national averages here. Learn more about the findings and methodology on the political spectrum map.
Nearby Neighborhoods
- Cathedral Park, Portland, OR D+66
- Portsmouth, Portland, OR D+61
- University Park, Portland, OR D+63
- Kenton, Portland, OR D+74
- Arbor Lodge, Portland, OR D+75
- Esther Short, Vancouver, WA D+46
- Overlook, Portland, OR D+83
- Bridgeton, Portland, OR D+32
- Woodlawn, Portland, OR D+78
- Forest Park, Portland, OR D+52
Neighborhoods with Similar Populations
- Tosa East Towne, Wauwatosa, WI D+52
- Tobin Hill, San Antonio, TX D+40
- Muncie-Stony PT., Kansas City, KS Even
- Sunshine, Lehigh Acres, FL D+6
- Stone Meadows, Bakersfield, CA R+4
- Downtown Boone, Boone, NC D+44
- Woodridge Lakes, Mesa, AZ R+12
- Coral Ridge, Fort Lauderdale, FL R+14
- Globe, Woonsocket, RI D+16
- Parkdale Viking Hills, Waco, TX R+15
Sources and methodology
Precinct-level voting records used to fit the model come from Oregon Secretary of State, Elections Division, distributed by the Voting and Election Science Team. Demographic inputs come from the U.S. Census Bureau (ACS 5-year estimates and the 2020 Decennial Census). Health and environmental inputs come from the CDC (PLACES and the Environmental Justice Index). Land cover comes from the USGS and EPA. Election-day and lead-up weather come from PRISM 4km daily grids and the NOAA Global Historical Climatology Network. Mail-voting and election-administration patterns come from the MIT Election Lab's Survey of the Performance of American Elections. Block-group crime detail comes from CrimeGrade. Internet data and modeling support provided by ISPreports.org.
Modeling and analysis by the BestNeighborhood data science team. Full methodology and findings: political spectrum map.
Methodology reviewed by the BestNeighborhood data team. Last updated May 2026.