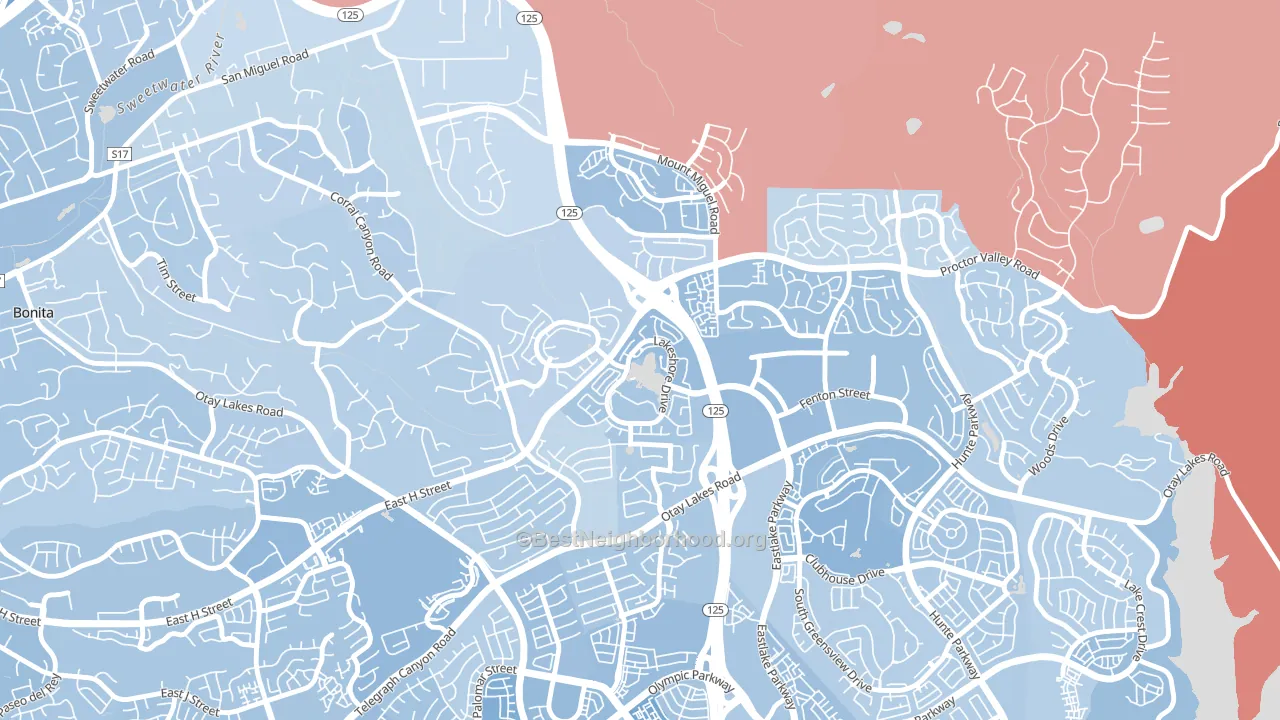
East Lake leans Democratic by roughly 16 points: about 58% of voters vote Democratic and 42% Republican.
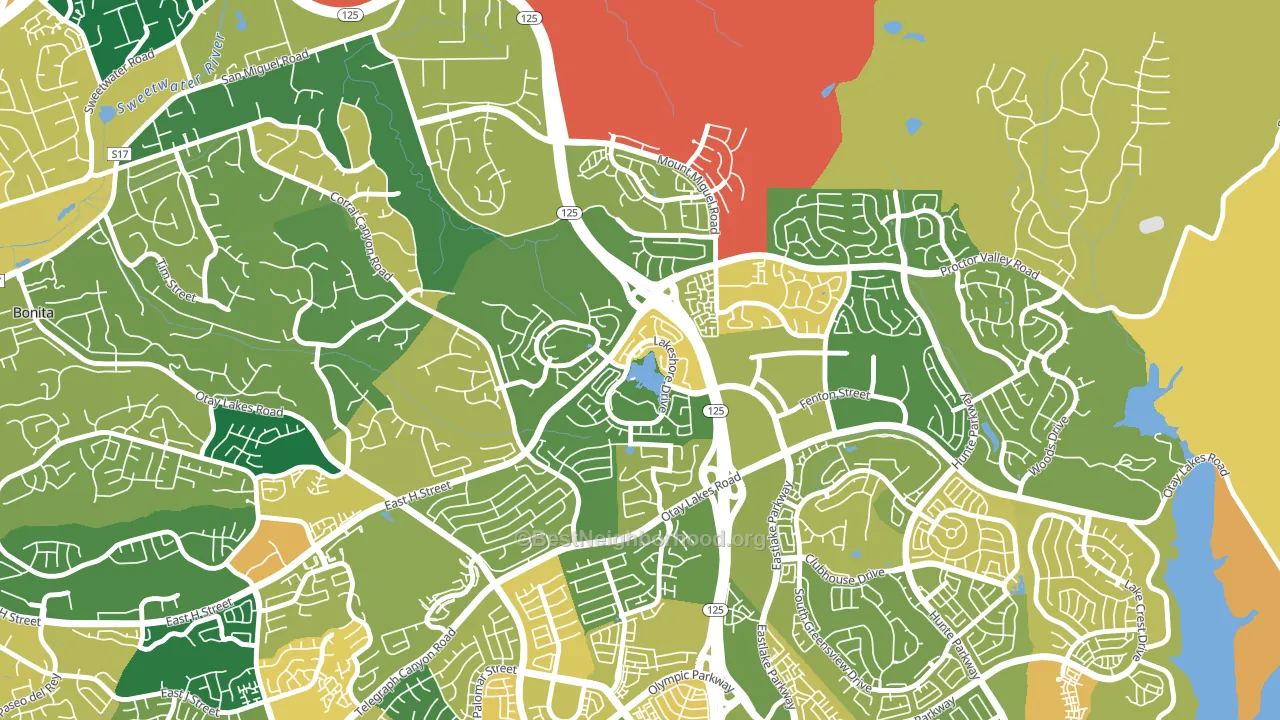
About 75% of adults in East Lake typically vote, above the U.S. average of about 62%. Among adults in East Lake, ~43% vote Democratic, ~32% Republican, and ~25% don't vote. The map below shows estimated turnout by block group.
How East Lake compares
Among neighborhoods within 5 miles, East Lake leans more Democratic than 7 of 15 neighbors.
East Lake runs about 4 points more Republican than California as a whole.
Politics vary noticeably by block within East Lake. The east side is the most Democratic-leaning (D+22) and the northwest side is the least Democratic-leaning (D+10), a spread of about 13 points.
Why East Lake leans the way it does
Density, race composition, education, and family structure all sit close to their national averages in East Lake. The lean here lands roughly where demographic data alone would predict.
Preventive-care access and voter turnout
Places with strong routine preventive-care access tend to turn out at a higher rate; East Lake, Chula Vista, CA sits above the national average on this measure. Dental visits do not drive turnout; the rate reflects income, insurance, and healthcare access, which line up with who votes.
Why turnout in East Lake looks the way it does
Turnout in East Lake sits close to the national pattern. Routine healthcare access, homeownership, education, and food security all land near their national averages here. Learn more about the findings and methodology on the political spectrum map.
Nearby Neighborhoods
- San Miguel Ranch, Chula Vista, CA D+11
- Rolling Hills Ranch, Chula Vista, CA D+9
- Bonita Long Canyon, Bonita, CA D+7
- Estlake Greens, Chula Vista, CA D+17
- Eastlake Trails, Chula Vista, CA D+15
- Rancho del Rey, Chula Vista, CA D+15
- Otay Ranch, Chula Vista, CA D+16
- Paseo Ranchoero, Chula Vista, CA D+16
- Eastlake Vistas, Chula Vista, CA D+19
- Lynwood Hills, Chula Vista, CA D+16
Neighborhoods with Similar Populations
- Centennial, Redwood City, CA D+61
- Fields Corner, Boston, MA D+49
- West Waco, Woodway, TX R+18
- Leonidas, New Orleans, LA D+70
- Downtown Durham, Durham, NC D+74
- Westside, Binghamton, NY D+43
- Marconi Plaza-Packer Park, Philadelphia, PA R+23
- Overlook, Summit, NJ D+27
- Rosebank, Staten Island, NY R+12
- Berkeley Place, Martinsburg, WV R+4
Sources and methodology
Precinct-level voting records used to fit the model come from California Secretary of State, Elections, distributed by the Voting and Election Science Team. Demographic inputs come from the U.S. Census Bureau (ACS 5-year estimates and the 2020 Decennial Census). Health and environmental inputs come from the CDC (PLACES and the Environmental Justice Index). Land cover comes from the USGS and EPA. Election-day and lead-up weather come from PRISM 4km daily grids and the NOAA Global Historical Climatology Network. Mail-voting and election-administration patterns come from the MIT Election Lab's Survey of the Performance of American Elections. Block-group crime detail comes from CrimeGrade. Internet data and modeling support provided by ISPreports.org.
Modeling and analysis by the BestNeighborhood data science team. Full methodology and findings: political spectrum map.
Methodology reviewed by the BestNeighborhood data team. Last updated May 2026.