East Village leans Republican by roughly 16 points: about 42% of voters vote Democratic and 58% Republican.
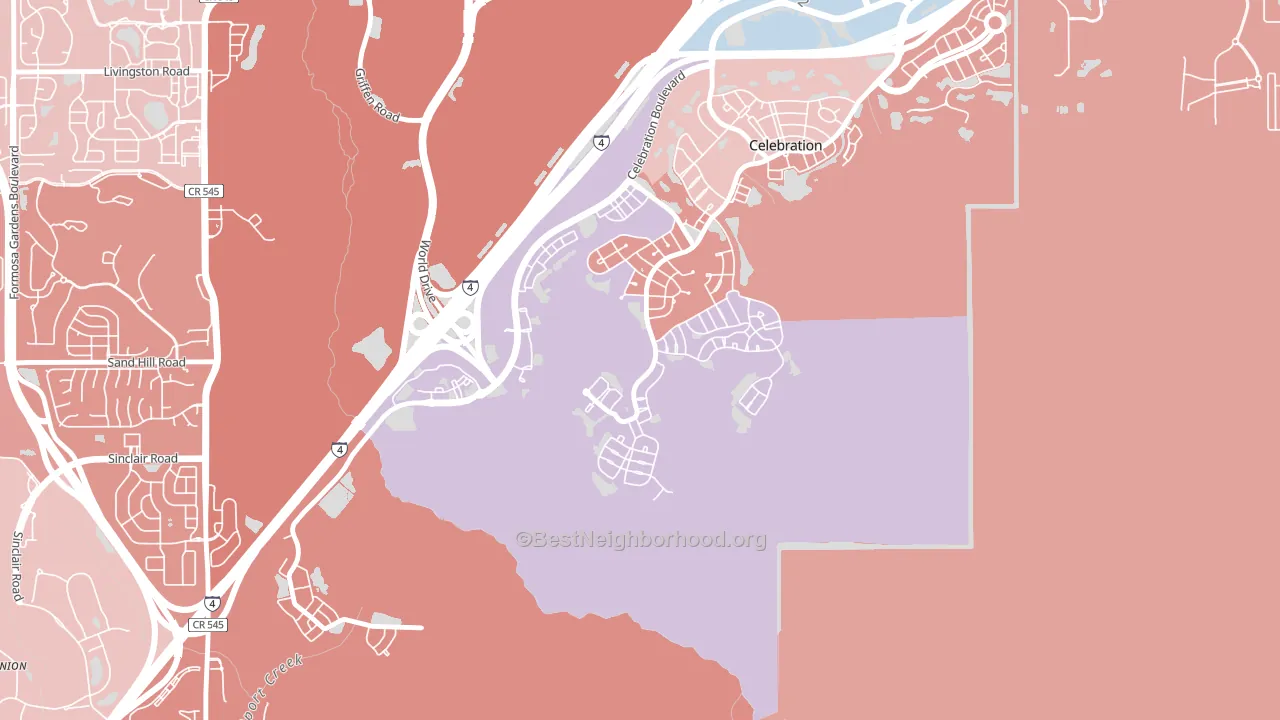
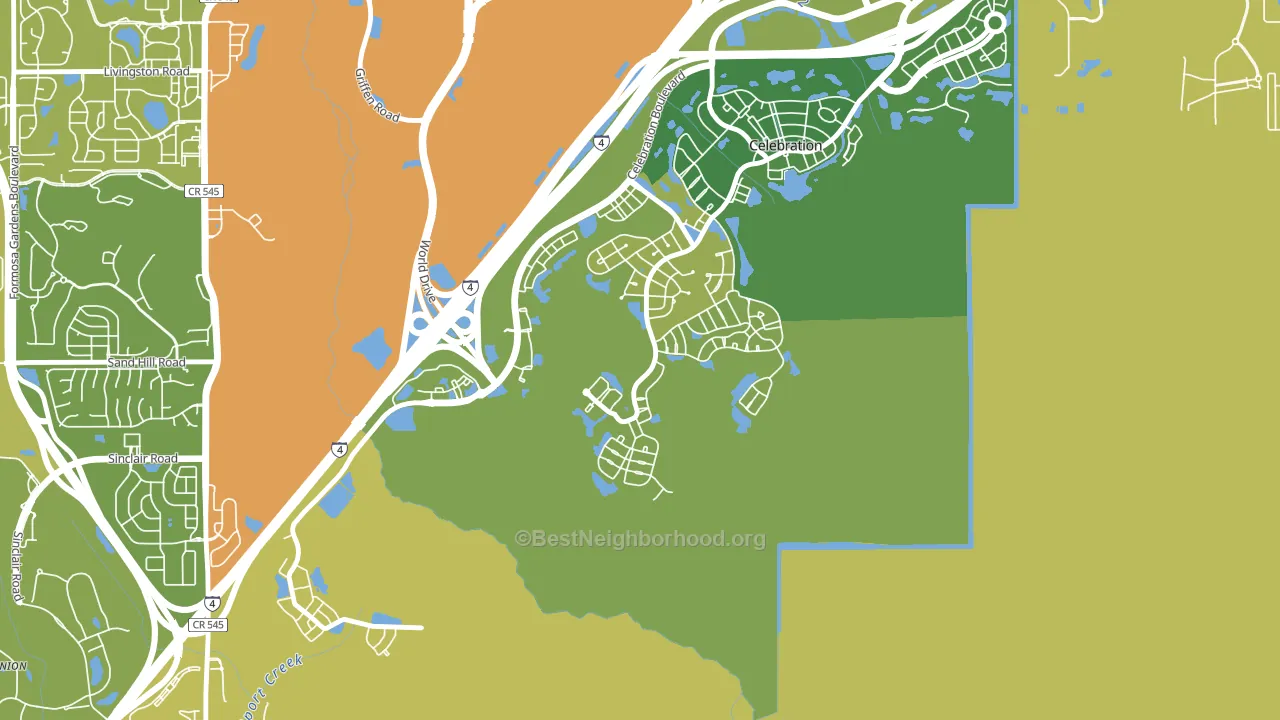
About 70% of adults in East Village typically vote, above the U.S. average of about 62%. Among adults in East Village, ~29% vote Democratic, ~41% Republican, and ~30% don't vote. The map below shows estimated turnout by block group.
How East Village compares
Politically, East Village sits close to the rest of Florida.
Why East Village leans the way it does
This analysis examined 14,881 data points per neighborhood to find what predicts political lean and turnout. The items below are a few correlations that stood out for East Village, not a ranked or complete list of what matters most.
Rural areas vote Republican. About 26% of residents in East Village live in densely developed areas, about 31 points below the Florida average of 57%.
Paved land cover and Republican lean
Places with little paved surface tend to lean Republican; East Village, Celebration, FL sits in the bottom quarter nationally on this measure. Paved ground does not change how people vote; it mostly reflects how urban and built-up a place is.
Why turnout in East Village looks the way it does
Turnout in East Village sits close to the national pattern. Routine healthcare access, homeownership, education, and food security all land near their national averages here. Learn more about the findings and methodology on the political spectrum map.
Nearby Neighborhoods
- Waterway Village, Kissimmee, FL D+6
- Westwood, Orlando, FL D+15
- Falcon Trace, Southchase, FL D+10
- Bellalago, Kissimmee, FL D+9
- Signature Lakes, Horizon West, FL R+6
- Southchase Village, Southchase, FL D+7
- Eden Isle, Horizon West, FL R+6
- Solivita, Poinciana, FL Even
- Eagle Bay, Kissimmee, FL D+11
- Florida Center, Orlando, FL D+21
Neighborhoods with Similar Populations
- Wahneta, Winter Haven, FL R+16
- Centerville, Camden, NJ D+72
- North Town Fork Creek, Kansas City, MO D+84
- Harrison East-South, Tucson, AZ D+9
- Franklin Plantation, Worcester, MA D+34
- State and Cypress, Kennett Square, PA D+28
- Orient Park, Tampa, FL D+9
- Westhaven Trails, Madison, WI D+65
- International, San Bernardino, CA D+28
- Wexford, Madison, WI D+63
Sources and methodology
Precinct-level voting records used to fit the model come from Florida Division of Elections, distributed by the Voting and Election Science Team. Demographic inputs come from the U.S. Census Bureau (ACS 5-year estimates and the 2020 Decennial Census). Health and environmental inputs come from the CDC (PLACES and the Environmental Justice Index). Land cover comes from the USGS and EPA. Election-day and lead-up weather come from PRISM 4km daily grids and the NOAA Global Historical Climatology Network. Mail-voting and election-administration patterns come from the MIT Election Lab's Survey of the Performance of American Elections. Block-group crime detail comes from CrimeGrade. Internet data and modeling support provided by ISPreports.org.
Modeling and analysis by the BestNeighborhood data science team. Full methodology and findings: political spectrum map.
Methodology reviewed by the BestNeighborhood data team. Last updated May 2026.