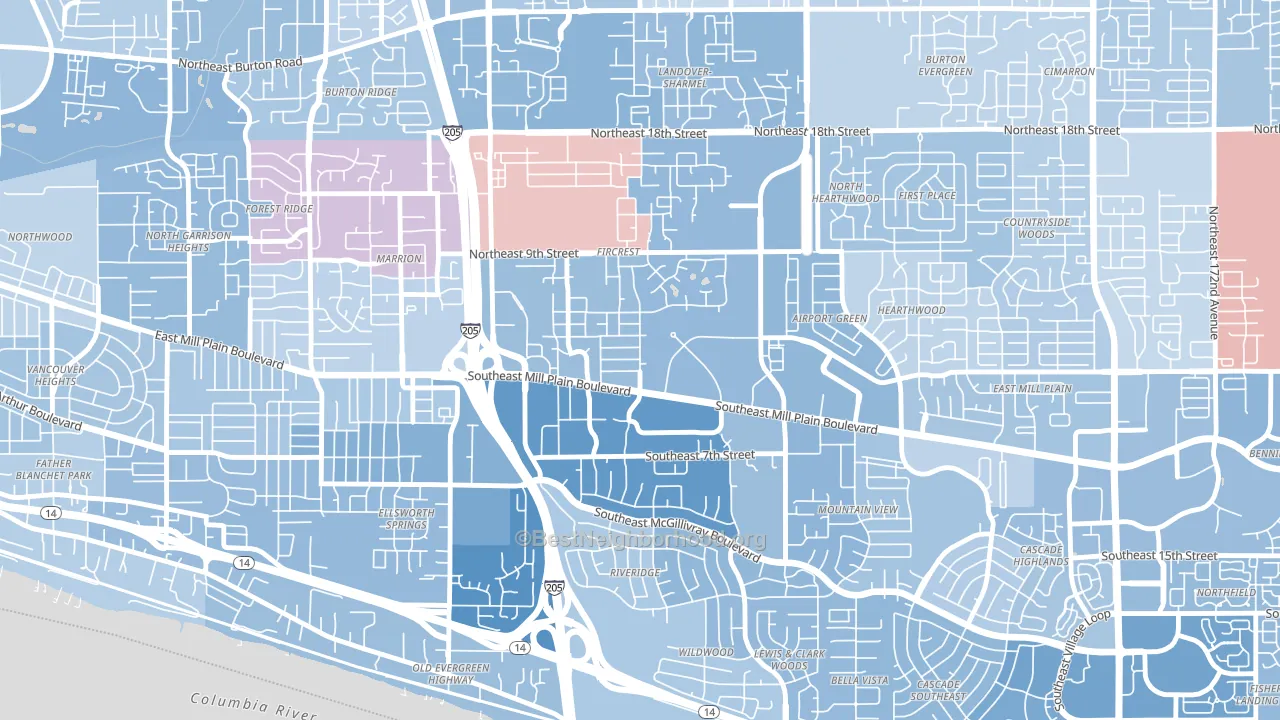
Fircrest leans Democratic by roughly 22 points: about 61% of voters vote Democratic and 39% Republican.
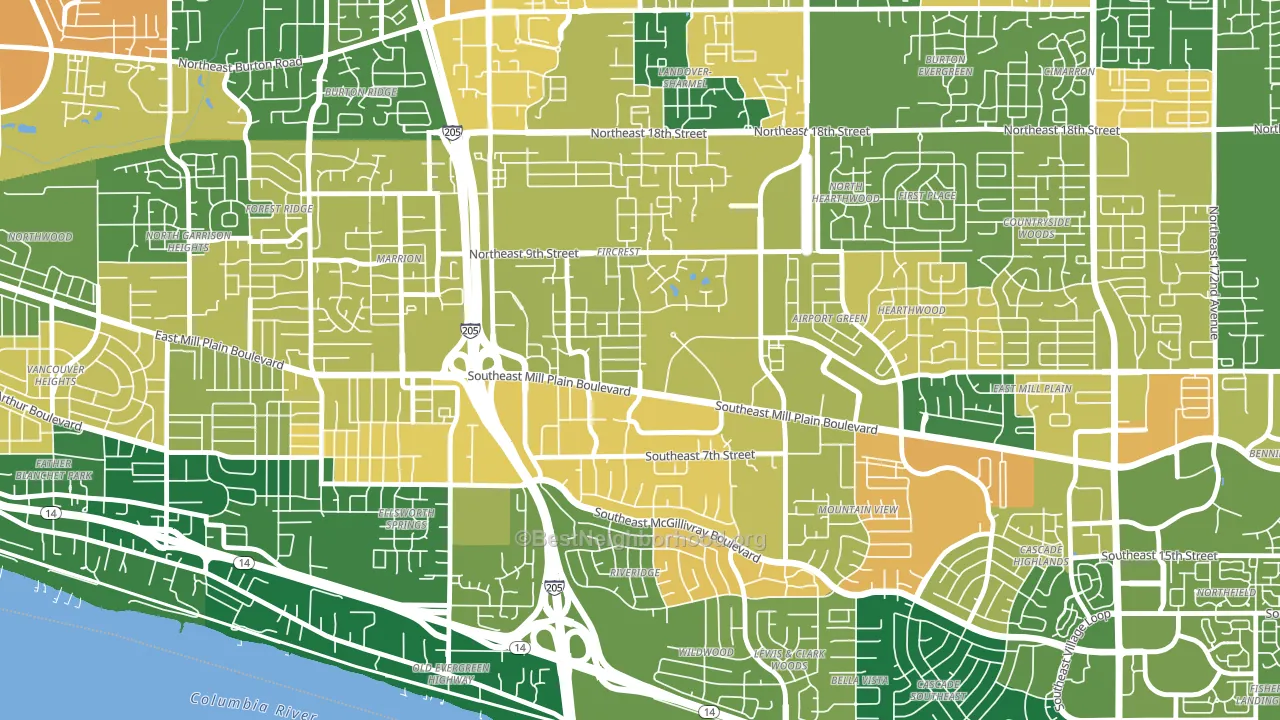
About 60% of adults in Fircrest typically vote, near the U.S. average of about 62%. Among adults in Fircrest, ~37% vote Democratic, ~23% Republican, and ~40% don't vote. The map below shows estimated turnout by block group.
How Fircrest compares
Among neighborhoods within 5 miles, Fircrest leans more Democratic than 16 of 21 neighbors.
Politically, Fircrest sits close to the rest of Washington.
Politics vary noticeably by block within Fircrest. The southwest side is the most Democratic-leaning (D+23) and the northwest side is the least Democratic-leaning (D+10), a spread of about 13 points.
Why Fircrest leans the way it does
Density, race composition, education, and family structure all sit close to their national averages in Fircrest. The lean here lands roughly where demographic data alone would predict.
Population density and Democratic lean
Places with high population density tend to lean Democratic; Fircrest, Vancouver, WA sits above the national average on this measure.
Why turnout in Fircrest looks the way it does
Renters vote less often than owners. About 63% of households in Fircrest rent, about 38 points above the U.S. average of 25%. Learn more about the findings and methodology on the political spectrum map.
Nearby Neighborhoods
- Ellsworth Springs, Vancouver, WA D+25
- Mountain View, Vancouver, WA D+18
- Marrion, Vancouver, WA D+15
- Landover-Sharmel, Vancouver, WA D+22
- Countryside Woods, Vancouver, WA D+13
- Cascade Highlands, Vancouver, WA D+15
- Image, Vancouver, WA D+4
- Vancouver Heights, Vancouver, WA D+19
- Oakbrook, Vancouver, WA D+13
- Kevanna Park, Vancouver, WA D+13
Neighborhoods with Similar Populations
- Samuel A Rothermel, Oak Park, IL D+73
- Townsend-Raitt, Santa Ana, CA D+34
- South Beach, Fort Pierce, FL R+24
- Rmma, Austin, TX D+61
- Downtown Fort Worth, Fort Worth, TX D+20
- middletown, Bethlehem, PA Even
- Shoreline West, Mountain View, CA D+54
- Cabbage Town, Atlanta, GA D+69
- Hillcrest, Jacksonville, FL D+24
- South Shore, Alameda, CA D+59
Sources and methodology
Precinct-level voting records used to fit the model come from Washington Secretary of State, Elections, distributed by the Voting and Election Science Team. Demographic inputs come from the U.S. Census Bureau (ACS 5-year estimates and the 2020 Decennial Census). Health and environmental inputs come from the CDC (PLACES and the Environmental Justice Index). Land cover comes from the USGS and EPA. Election-day and lead-up weather come from PRISM 4km daily grids and the NOAA Global Historical Climatology Network. Mail-voting and election-administration patterns come from the MIT Election Lab's Survey of the Performance of American Elections. Block-group crime detail comes from CrimeGrade. Internet data and modeling support provided by ISPreports.org.
Modeling and analysis by the BestNeighborhood data science team. Full methodology and findings: political spectrum map.
Methodology reviewed by the BestNeighborhood data team. Last updated May 2026.