Kevanna Park leans slightly Democratic by roughly 14 points: about 57% of voters vote Democratic and 43% Republican.
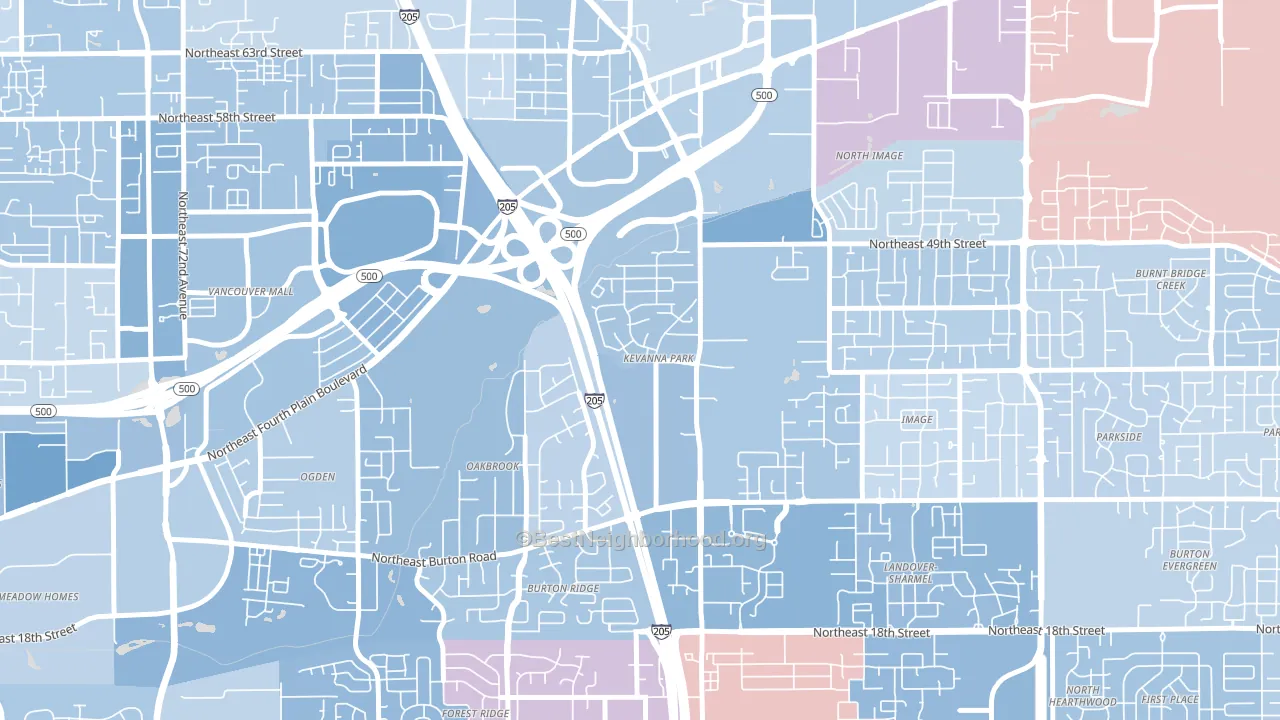
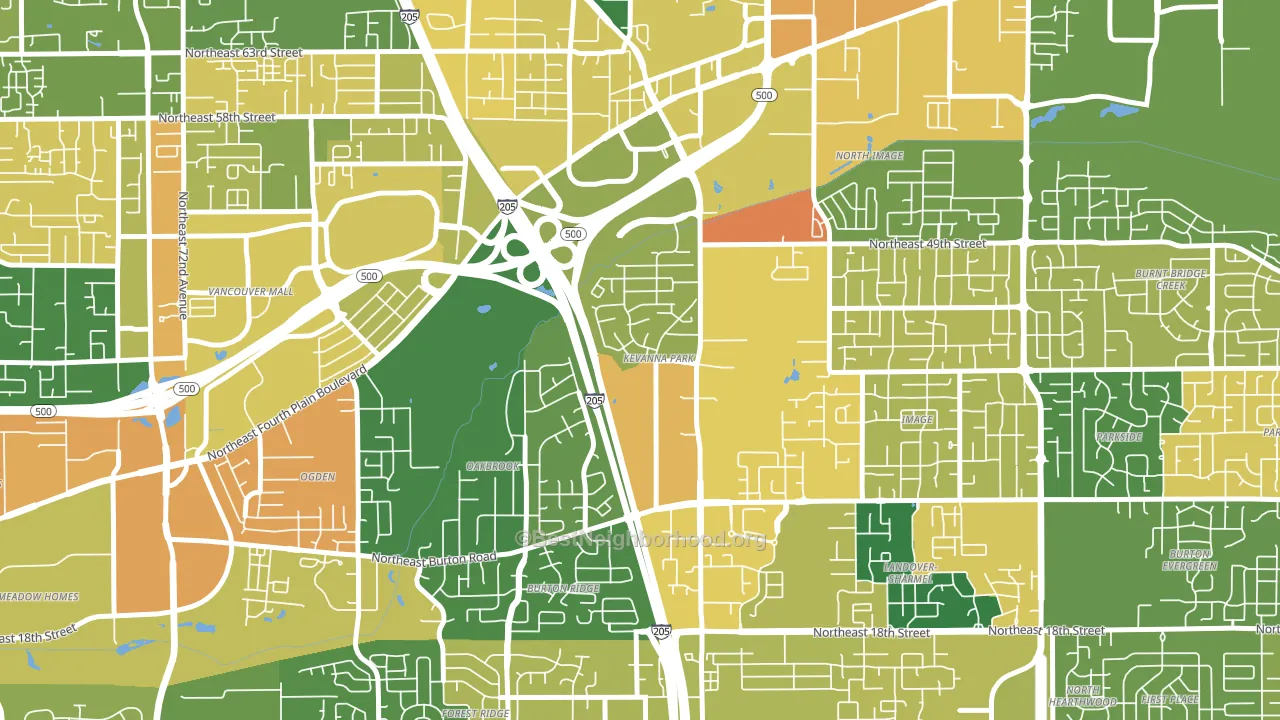
About 53% of adults in Kevanna Park typically vote, below the U.S. average of about 62%. Among adults in Kevanna Park, ~30% vote Democratic, ~23% Republican, and ~47% don't vote. The map below shows estimated turnout by block group.
How Kevanna Park compares
Among neighborhoods within 5 miles, Kevanna Park leans more Democratic than 8 of 24 neighbors.
Kevanna Park runs about 5 points more Republican than Washington as a whole.
Why Kevanna Park leans the way it does
This analysis examined 14,881 data points per neighborhood to find what predicts political lean and turnout. The items below are a few correlations that stood out for Kevanna Park, not a ranked or complete list of what matters most.
Dense areas vote Democratic. More than 99% of residents in Kevanna Park live in densely developed areas, about 64 points above the U.S. average of 36%.
Population density and Democratic lean
Places with high population density tend to lean Democratic; Kevanna Park, Vancouver, WA sits above the national average on this measure.
Why turnout in Kevanna Park looks the way it does
Renters vote less often than owners. About 61% of households in Kevanna Park rent, about 36 points above the U.S. average of 25%. Learn more about the findings and methodology on the political spectrum map.
Nearby Neighborhoods
- Oakbrook, Vancouver, WA D+13
- Image, Vancouver, WA D+4
- North Image, Vancouver, WA D+6
- Landover-Sharmel, Vancouver, WA D+22
- Ogden, Vancouver, WA D+20
- Marrion, Vancouver, WA D+15
- Van Mall, Vancouver, WA D+23
- Burnt Bridge Creek, Vancouver, WA Even
- Fircrest, Vancouver, WA D+21
- Vancouver Heights, Vancouver, WA D+19
Neighborhoods with Similar Populations
- Towson Park, Towson, MD D+61
- Town and Country Manor, Milwaukee, WI D+74
- Haggin Oaks, Bakersfield, CA R+19
- Crown Meadows, San Antonio, TX D+22
- Grand Center, St. Louis, MO D+74
- Westfield, Baltimore, MD D+66
- Clanton Park-Roseland, Charlotte, NC D+83
- The Hills of Park North, San Antonio, TX D+15
- Downtown Pomona, Pomona, CA D+36
- Lance, Kenosha, WI D+7
Sources and methodology
Precinct-level voting records used to fit the model come from Washington Secretary of State, Elections, distributed by the Voting and Election Science Team. Demographic inputs come from the U.S. Census Bureau (ACS 5-year estimates and the 2020 Decennial Census). Health and environmental inputs come from the CDC (PLACES and the Environmental Justice Index). Land cover comes from the USGS and EPA. Election-day and lead-up weather come from PRISM 4km daily grids and the NOAA Global Historical Climatology Network. Mail-voting and election-administration patterns come from the MIT Election Lab's Survey of the Performance of American Elections. Block-group crime detail comes from CrimeGrade. Internet data and modeling support provided by ISPreports.org.
Modeling and analysis by the BestNeighborhood data science team. Full methodology and findings: political spectrum map.
Methodology reviewed by the BestNeighborhood data team. Last updated May 2026.