Marrion leans slightly Democratic by roughly 14 points: about 57% of voters vote Democratic and 43% Republican.
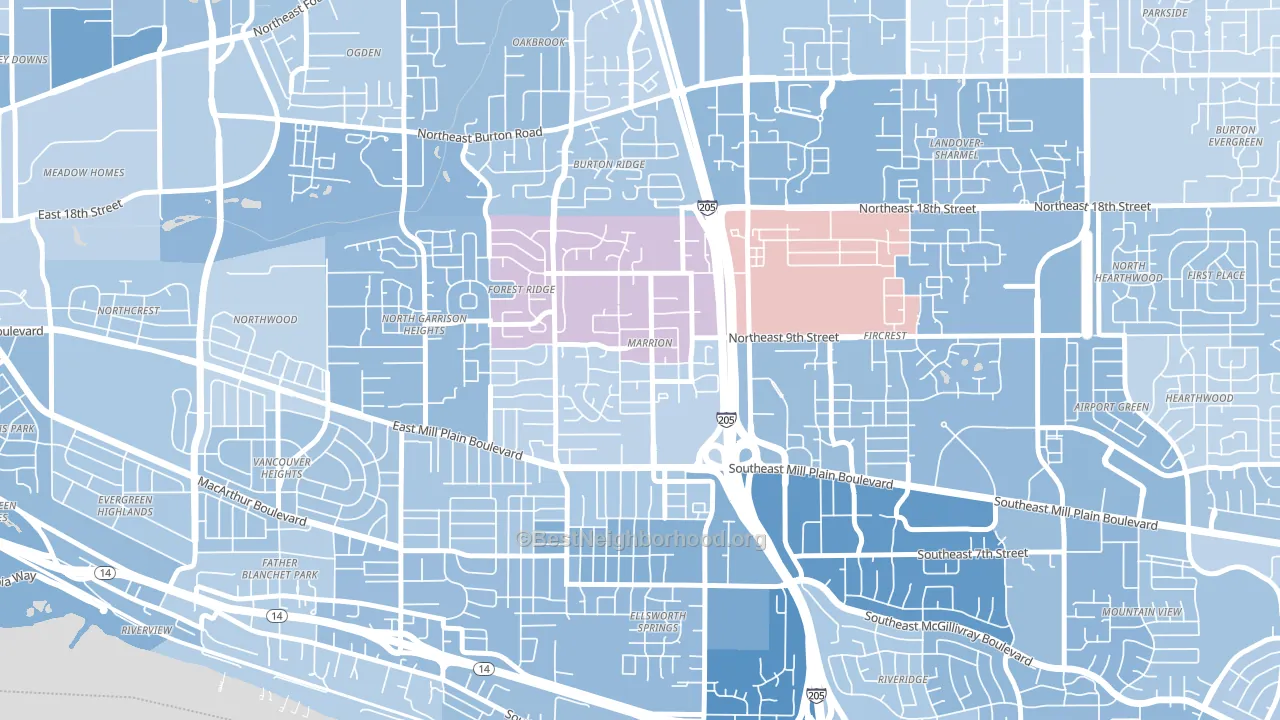
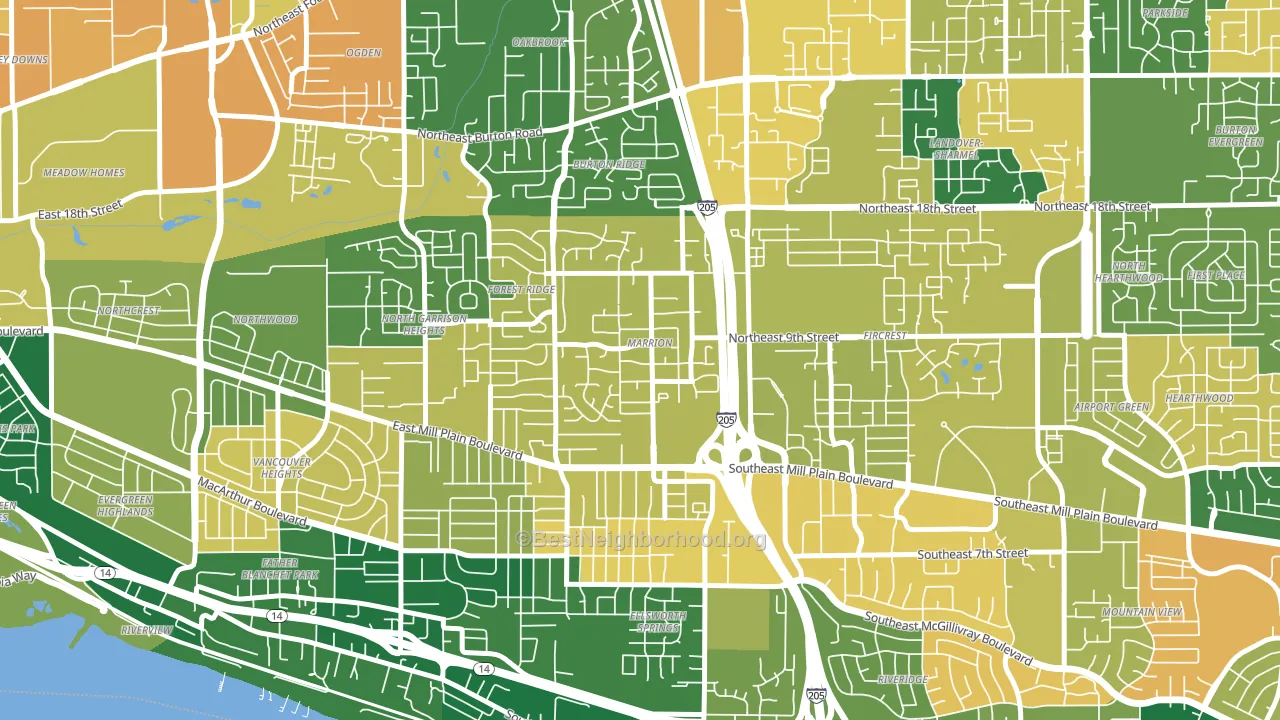
About 63% of adults in Marrion typically vote, near the U.S. average of about 62%. Among adults in Marrion, ~36% vote Democratic, ~27% Republican, and ~37% don't vote. The map below shows estimated turnout by block group.
How Marrion compares
Among neighborhoods within 5 miles, Marrion leans more Democratic than 9 of 24 neighbors.
Politically, Marrion sits close to the rest of Washington.
Why Marrion leans the way it does
Density, race composition, education, and family structure all sit close to their national averages in Marrion. The lean here lands roughly where demographic data alone would predict.
Park access and Democratic lean
Places with heavy park coverage tend to lean Democratic; Marrion, Vancouver, WA sits in the top quarter nationally on this measure. Park access does not change how people vote; it tends to track denser, higher-income areas.
Why turnout in Marrion looks the way it does
Areas with high high-school completion turn out at higher rates. About 99% of adults in Marrion have completed high school, about 7 points above the Washington average of 91%. Learn more about the findings and methodology on the political spectrum map.
Nearby Neighborhoods
- Ellsworth Springs, Vancouver, WA D+25
- Fircrest, Vancouver, WA D+21
- Vancouver Heights, Vancouver, WA D+19
- Oakbrook, Vancouver, WA D+13
- Landover-Sharmel, Vancouver, WA D+22
- Ogden, Vancouver, WA D+20
- Kevanna Park, Vancouver, WA D+13
- Image, Vancouver, WA D+4
- Mountain View, Vancouver, WA D+18
- North Image, Vancouver, WA D+6
Neighborhoods with Similar Populations
- Mohican Regent, Detroit, MI D+85
- Park Hill, Louisville, KY D+84
- Dudley, Camden, NJ D+48
- Bay Colony, Fort Lauderdale, FL R+7
- The Gate District, St. Louis, MO D+75
- York, Bellingham, WA D+69
- Kirkman South, Orlando, FL D+8
- Hale, Minneapolis, MN D+76
- Ashbrook-Clawson Village, Charlotte, NC D+27
- Southdale, Edina, MN D+48
Sources and methodology
Precinct-level voting records used to fit the model come from Washington Secretary of State, Elections, distributed by the Voting and Election Science Team. Demographic inputs come from the U.S. Census Bureau (ACS 5-year estimates and the 2020 Decennial Census). Health and environmental inputs come from the CDC (PLACES and the Environmental Justice Index). Land cover comes from the USGS and EPA. Election-day and lead-up weather come from PRISM 4km daily grids and the NOAA Global Historical Climatology Network. Mail-voting and election-administration patterns come from the MIT Election Lab's Survey of the Performance of American Elections. Block-group crime detail comes from CrimeGrade. Internet data and modeling support provided by ISPreports.org.
Modeling and analysis by the BestNeighborhood data science team. Full methodology and findings: political spectrum map.
Methodology reviewed by the BestNeighborhood data team. Last updated May 2026.