Ginter Park is a Democratic stronghold. About 86% of voters here vote Democratic and 14% Republican.
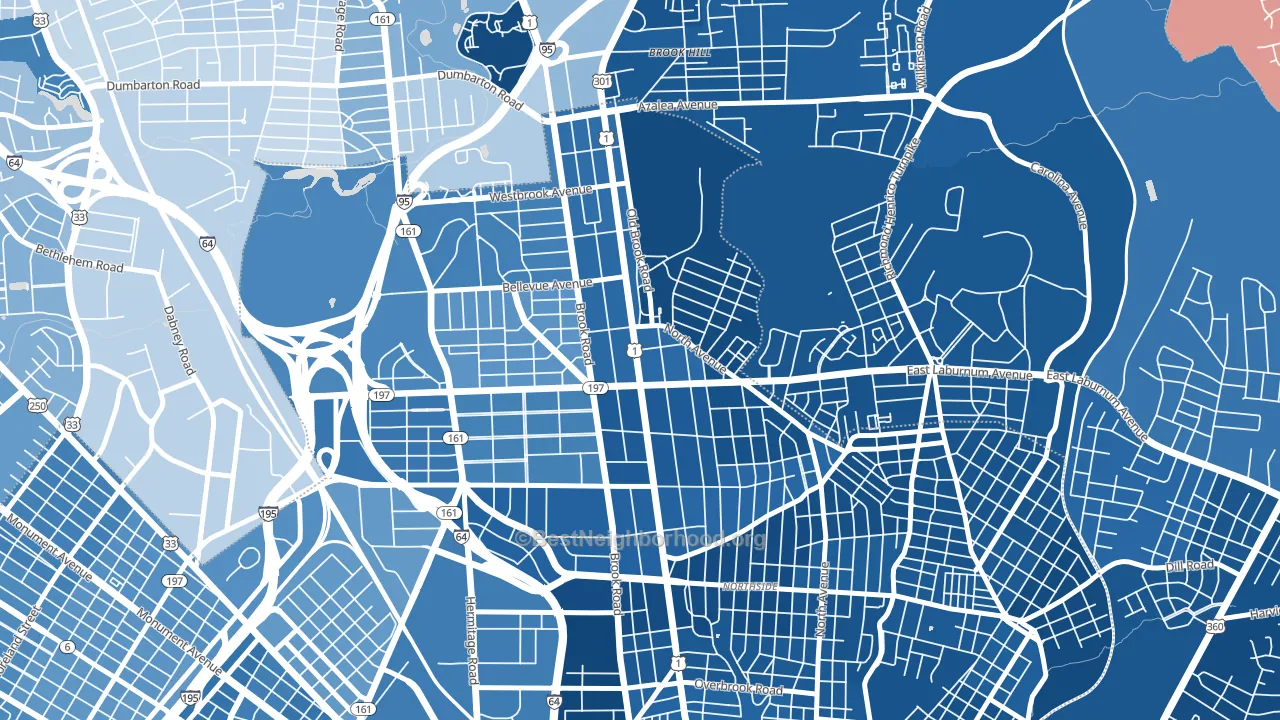
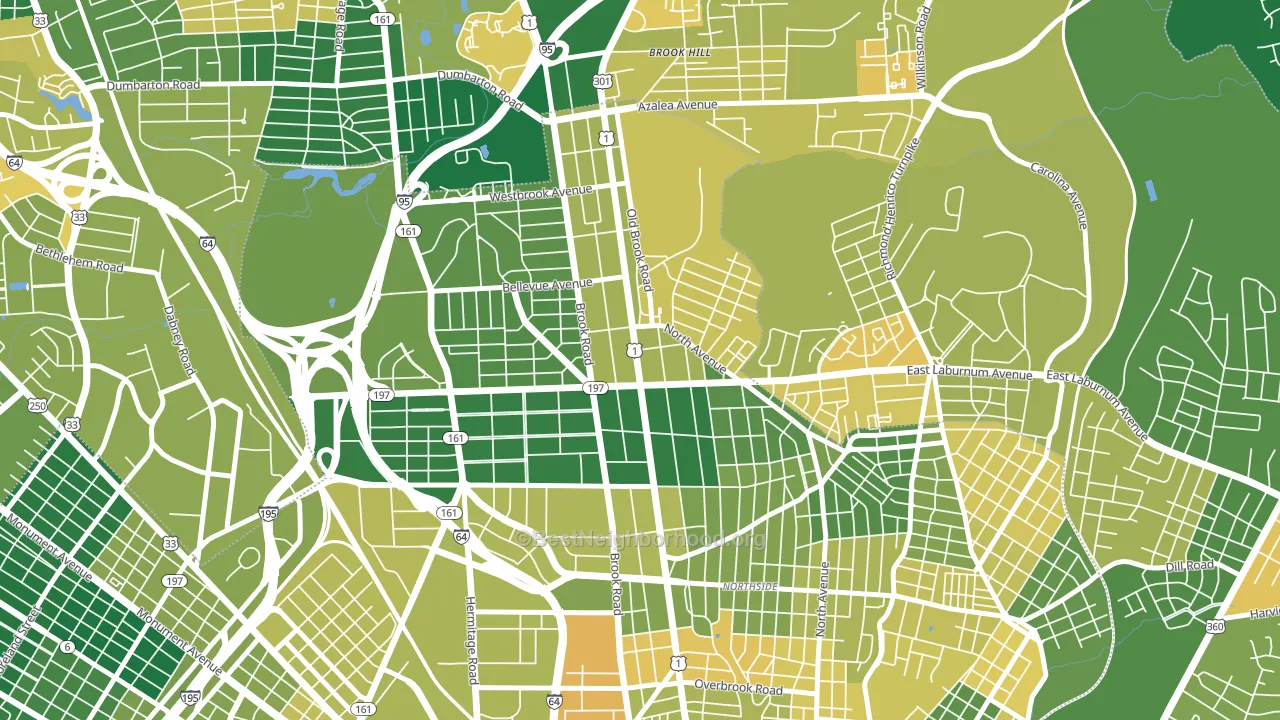
About 83% of adults in Ginter Park typically vote, above the U.S. average of about 62%. Among adults in Ginter Park, ~71% vote Democratic, ~12% Republican, and ~17% don't vote. The map below shows estimated turnout by block group.
How Ginter Park compares
Among neighborhoods within 5 miles, Ginter Park leans more Democratic than 9 of 11 neighbors.
Ginter Park runs about 66 points more Democratic than Virginia as a whole.
Politics vary noticeably by block within Ginter Park. The east side is the most Democratic-leaning (D+80) and the northwest side is the least Democratic-leaning (D+53), a spread of about 28 points.
Why Ginter Park leans the way it does
Density, race composition, education, and family structure all sit close to their national averages in Ginter Park. The lean here lands roughly where demographic data alone would predict.
Preventive-care access and voter turnout
Places with strong routine preventive-care access tend to turn out at a higher rate; Ginter Park, Richmond, VA sits in the top quarter nationally on this measure. Dental visits do not drive turnout; the rate reflects income, insurance, and healthcare access, which line up with who votes.
Why turnout in Ginter Park looks the way it does
Areas with strong routine healthcare access turn out at higher rates. Ginter Park is in the top quarter nationally for routine-care measures such as insurance coverage, preventive screenings, and dental visits. The dental-visit rate here is about 73%, about 13 points above the U.S. average of 60%. Learn more about the findings and methodology on the political spectrum map.
Nearby Neighborhoods
- Bellevue, Richmond, VA D+49
- Carver-Richmond, Richmond, VA D+70
- The Museum District, Richmond, VA D+65
- The Fan, Richmond, VA D+65
- VCU, Richmond, VA D+71
- Monroe Ward, Richmond, VA D+56
- Creighton, Richmond, VA D+84
- Shockoe Bottom, Richmond, VA D+65
- Church Hill, Richmond, VA D+74
- Three Chopt, Richmond, VA D+23
Neighborhoods with Similar Populations
- River Oaks, Memphis, TN D+15
- Centretech, Aurora, CO D+34
- Chandler Heights, Garland, TX D+14
- Cornerstone Village North, Houston, TX D+39
- Cedonia, Baltimore, MD D+84
- Glenwood Meadows, Sacramento, CA D+26
- Mount Pleasant, St. Louis, MO D+61
- Tevis Ranch, Bakersfield, CA R+17
- West Plaza, Kansas City, MO D+56
- Westside Development, Tucson, AZ D+27
Sources and methodology
Precinct-level voting records used to fit the model come from Virginia Department of Elections, distributed by the Voting and Election Science Team. Demographic inputs come from the U.S. Census Bureau (ACS 5-year estimates and the 2020 Decennial Census). Health and environmental inputs come from the CDC (PLACES and the Environmental Justice Index). Land cover comes from the USGS and EPA. Election-day and lead-up weather come from PRISM 4km daily grids and the NOAA Global Historical Climatology Network. Mail-voting and election-administration patterns come from the MIT Election Lab's Survey of the Performance of American Elections. Block-group crime detail comes from CrimeGrade. Internet data and modeling support provided by ISPreports.org.
Modeling and analysis by the BestNeighborhood data science team. Full methodology and findings: political spectrum map.
Methodology reviewed by the BestNeighborhood data team. Last updated May 2026.