Refugio County leans heavily Republican by roughly 36 points: about 32% of voters vote Democratic and 68% Republican.
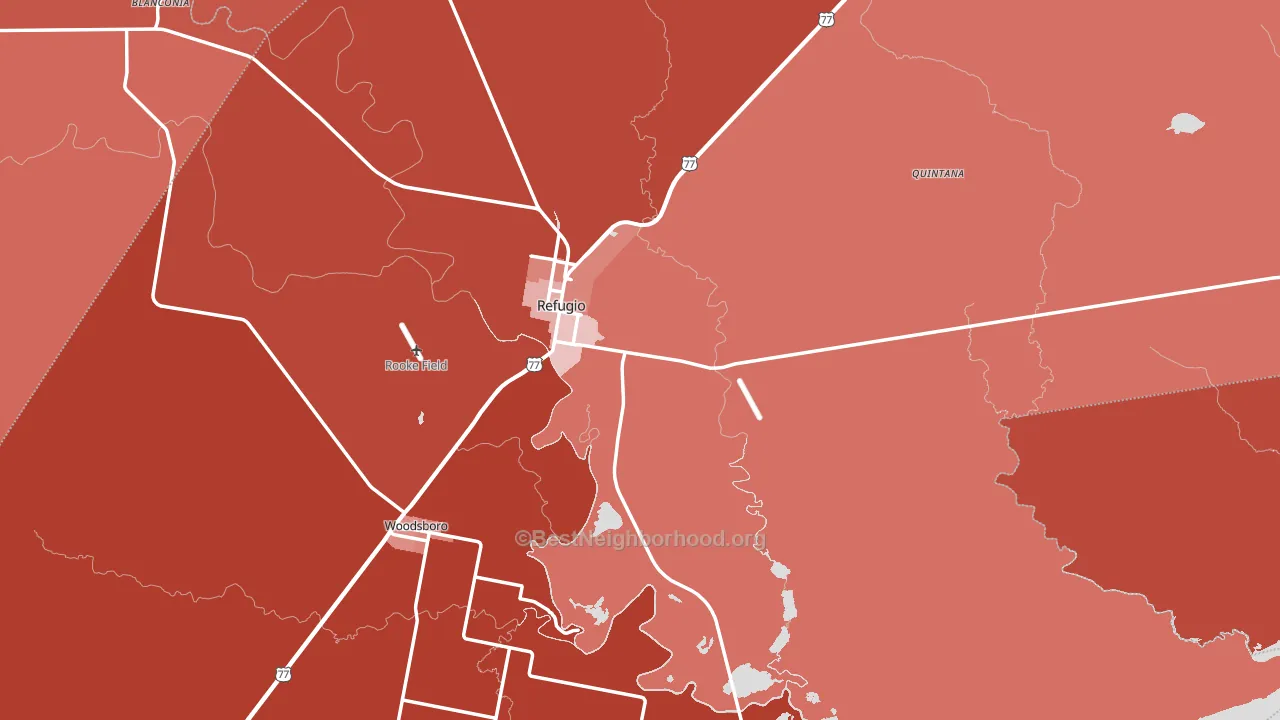
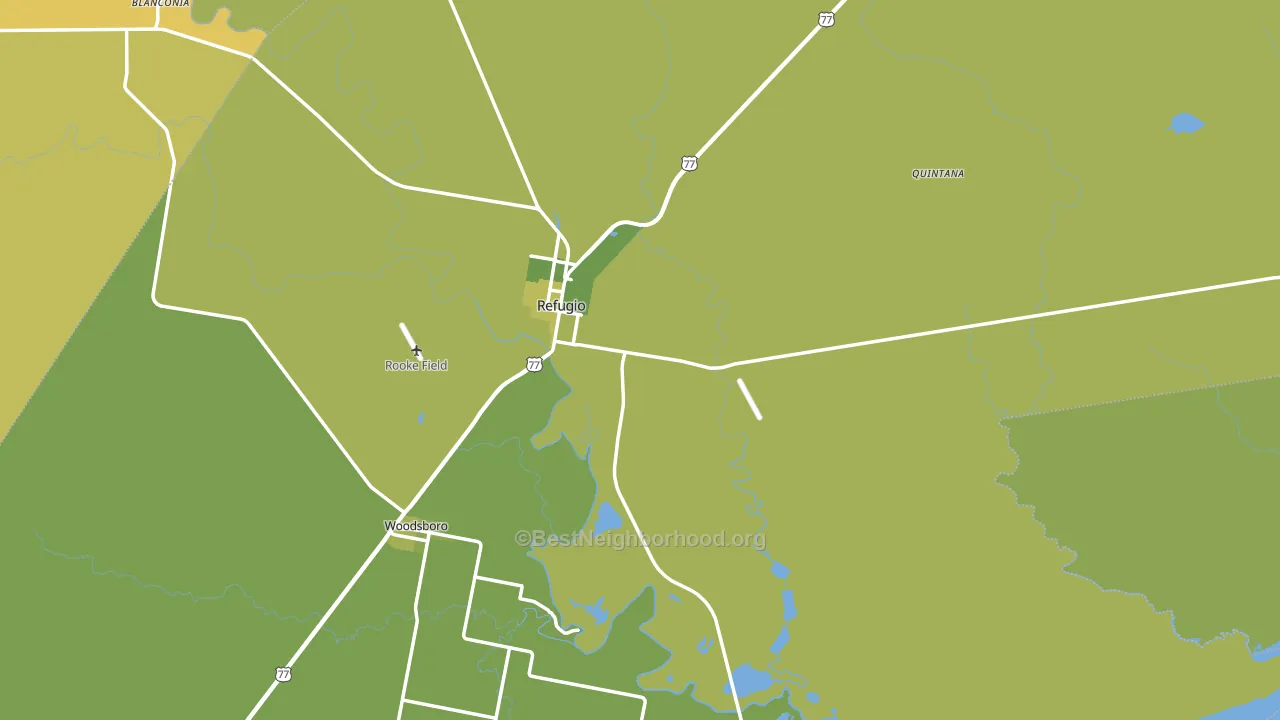
About 67% of adults in Refugio County typically vote, near the U.S. average of about 62%. Among adults in Refugio County, ~22% vote Democratic, ~46% Republican, and ~32% don't vote. The map below shows estimated turnout by block group.
How Refugio County compares
Among counties within 50 miles, Refugio County leans more Republican than 4 of 7 neighbors.
Refugio County runs about 22 points more Republican than Texas as a whole.
Politics vary noticeably by city within Refugio County. The south side is the most Republican-leaning (R+59) and the east side is the least Republican-leaning (R+28), a spread of about 31 points.
Why Refugio County leans the way it does
This analysis examined 14,881 data points per county to find what predicts political lean and turnout. The items below are a few correlations that stood out for Refugio County, not a ranked or complete list of what matters most.
Car-dependent areas vote Republican. About 87% of residents in Refugio County drive to work alone, about 13 points above the U.S. average of 74%. Low college attainment predicts Republican voting, and Refugio County sits in the bottom quarter (about 14%, below 92% of counties).
Preventive-care access and voter turnout
Places with limited routine preventive-care access tend to turn out at a lower rate; Refugio County, TX sits in the bottom quarter nationally on this measure. Dental visits do not drive turnout; the rate reflects income, insurance, and healthcare access, which line up with who votes.
Why turnout in Refugio County looks the way it does
Areas with limited routine healthcare access turn out at lower rates. Refugio County is in the bottom quarter nationally for routine-care measures such as insurance coverage, preventive screenings, and dental visits. The dental-visit rate here is about 50%, about 10 points below the U.S. average of 60%. Learn more about the findings and methodology on the political spectrum map.
Nearby Counties
- Aransas County, TX R+46
- San Patricio County, TX R+31
- Goliad County, TX R+60
- Bee County, TX R+22
- Victoria County, TX R+28
- Nueces County, TX R+4
- Calhoun County, TX R+37
- Live Oak County, TX R+61
- Karnes County, TX R+35
- DeWitt County, TX R+49
Counties with Similar Populations
- Clinch County, GA R+51
- Burt County, NE R+55
- Tucker County, WV R+50
- Galax City, VA R+38
- Lac qui Parle County, MN R+38
- Charles City County, VA D+8
- Thurston County, NE D+23
- Broadwater County, MT R+54
- Russell County, KS R+59
- Kearney County, NE R+59
Sources and methodology
Precinct-level voting records used to fit the model come from Texas Secretary of State, Elections Division, distributed by the Voting and Election Science Team. Demographic inputs come from the U.S. Census Bureau (ACS 5-year estimates and the 2020 Decennial Census). Health and environmental inputs come from the CDC (PLACES and the Environmental Justice Index). Land cover comes from the USGS and EPA. Election-day and lead-up weather come from PRISM 4km daily grids and the NOAA Global Historical Climatology Network. Mail-voting and election-administration patterns come from the MIT Election Lab's Survey of the Performance of American Elections. Block-group crime detail comes from CrimeGrade. Internet data and modeling support provided by ISPreports.org.
Modeling and analysis by the BestNeighborhood data science team. Full methodology and findings: political spectrum map.
Methodology reviewed by the BestNeighborhood data team. Last updated May 2026.