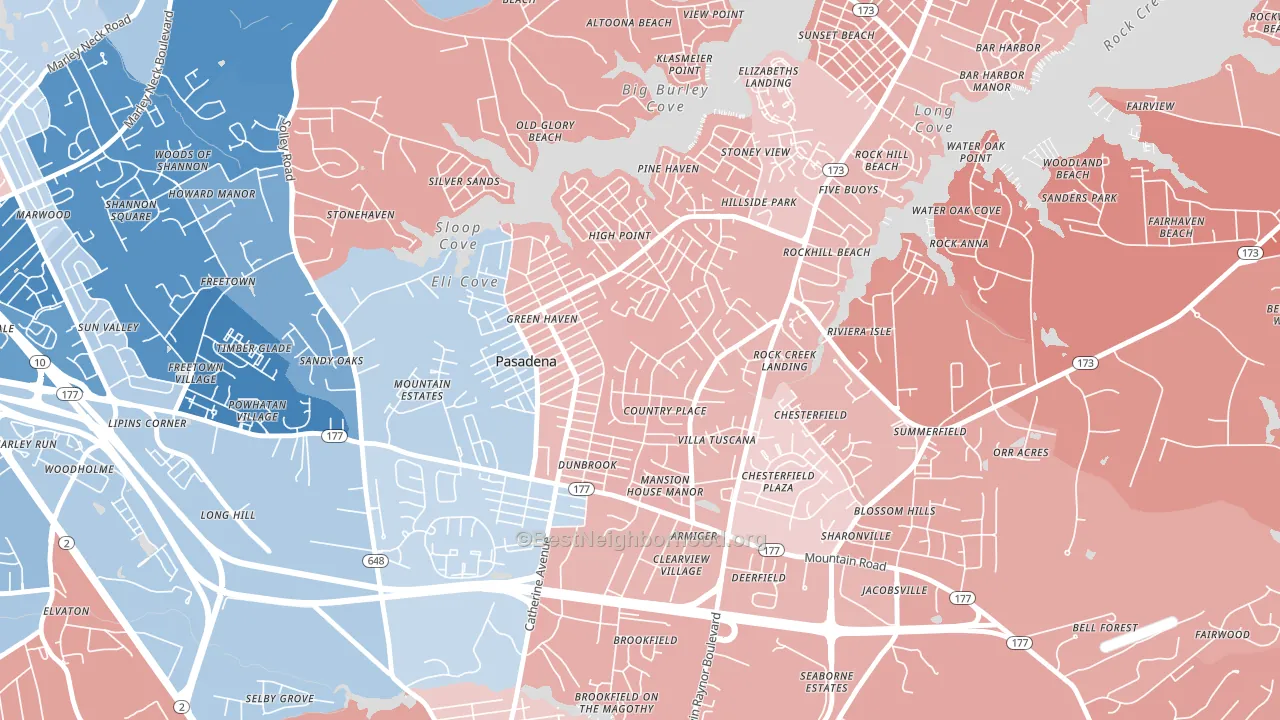
Green Haven leans slightly Republican by roughly 12 points: about 44% of voters vote Democratic and 56% Republican.
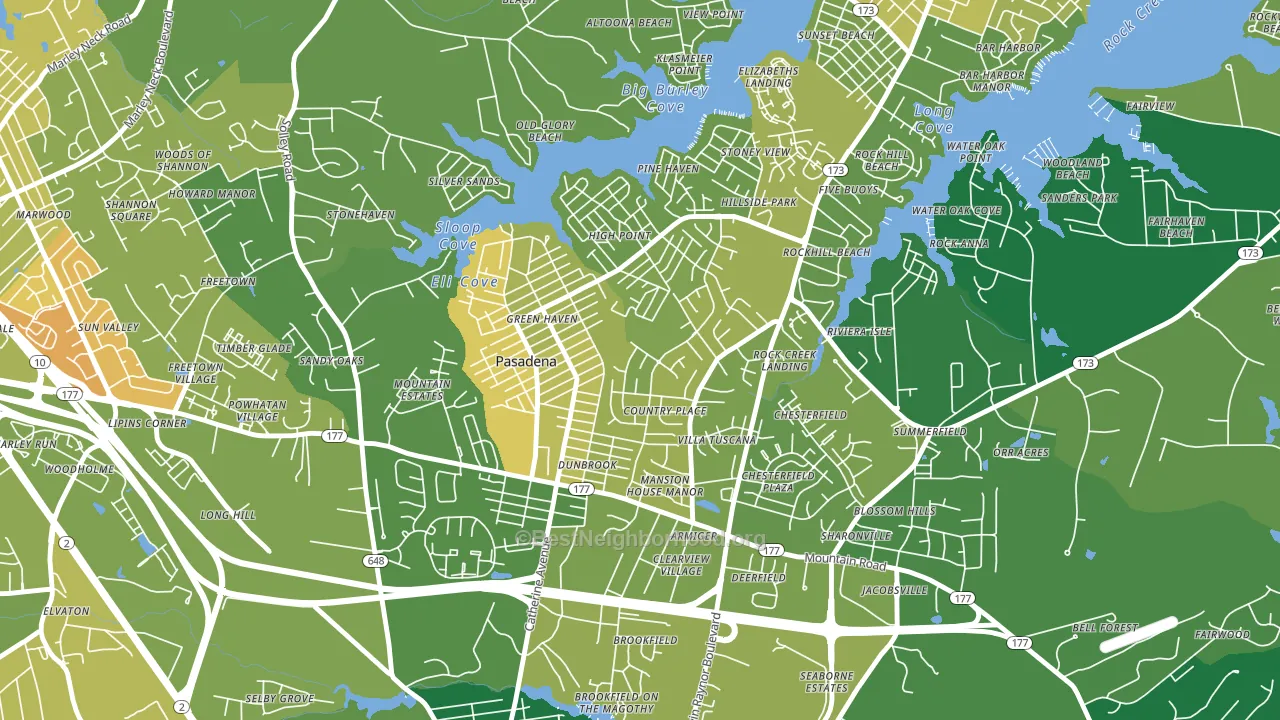
About 74% of adults in Green Haven typically vote, above the U.S. average of about 62%. Among adults in Green Haven, ~33% vote Democratic, ~42% Republican, and ~25% don't vote. The map below shows estimated turnout by block group.
How Green Haven compares
Green Haven sits in a sparsely populated area with few comparable neighborhoods nearby.
Green Haven runs about 41 points more Republican than Maryland as a whole. Maryland leans Democratic overall, while Green Haven is one of the few Republican-leaning pockets.
Politics vary noticeably by block within Green Haven. The southwest side runs the most Democratic (Even) and the northeast side runs the most Republican (R+24), a spread of about 25 points.
Why Green Haven leans the way it does
This analysis examined 14,881 data points per neighborhood to find what predicts political lean and turnout. The items below are a few correlations that stood out for Green Haven, not a ranked or complete list of what matters most.
Green Haven votes against the grain of Maryland. Maryland leans Democratic overall, while Green Haven runs about 41 points more Republican. A high family-household share predicts Republican voting, and about 76% of households in Green Haven are family households, above 79% of neighborhoods.
Renting and voter turnout
Places with homeowner-heavy households tend to turn out at a higher rate; Green Haven, Pasadena, MD sits in the bottom quarter nationally on this measure.
Why turnout in Green Haven looks the way it does
Homeowners vote more often than renters. About 91% of households in Green Haven own their home, about 14 points above the Maryland average of 77%. Learn more about the findings and methodology on the political spectrum map.
Nearby Neighborhoods
- School Gardens, Riviera Beach, MD R+19
- South Gate, Glen Burnie, MD D+32
- Brooklyn-Curtis Bay, Brooklyn, MD D+37
- Hillcrest, Brooklyn Park, MD D+11
- Pumphrey, Linthicum, MD D+9
- Turners, Dundalk, MD D+12
- Eastfield, Dundalk, MD R+6
- Inverness, Dundalk, MD Even
- Cherry Hill, Brooklyn, MD D+82
- Norwood Park, Dundalk, MD R+14
Neighborhoods with Similar Populations
- Ashburn Village, Ashburn, VA D+26
- Ballard, Seattle, WA D+73
- Midtown, Houston, TX D+42
- Love Field Area, Dallas, TX D+36
- Emmons Orchard, Lincoln Park, MI R+3
- Forest Park, Portland, OR D+52
- Mt Pleasant, Cleveland, OH D+87
- The Avenues, Salt Lake City, UT D+64
- Greenfield, Detroit, MI D+87
- Northwest Nashua, Nashua, NH D+23
Sources and methodology
Precinct-level voting records used to fit the model come from Maryland State Board of Elections, distributed by the Voting and Election Science Team. Demographic inputs come from the U.S. Census Bureau (ACS 5-year estimates and the 2020 Decennial Census). Health and environmental inputs come from the CDC (PLACES and the Environmental Justice Index). Land cover comes from the USGS and EPA. Election-day and lead-up weather come from PRISM 4km daily grids and the NOAA Global Historical Climatology Network. Mail-voting and election-administration patterns come from the MIT Election Lab's Survey of the Performance of American Elections. Block-group crime detail comes from CrimeGrade. Internet data and modeling support provided by ISPreports.org.
Modeling and analysis by the BestNeighborhood data science team. Full methodology and findings: political spectrum map.
Methodology reviewed by the BestNeighborhood data team. Last updated May 2026.