Emmons Orchard is a true toss-up. About 48% of voters here vote Democratic and 52% Republican.
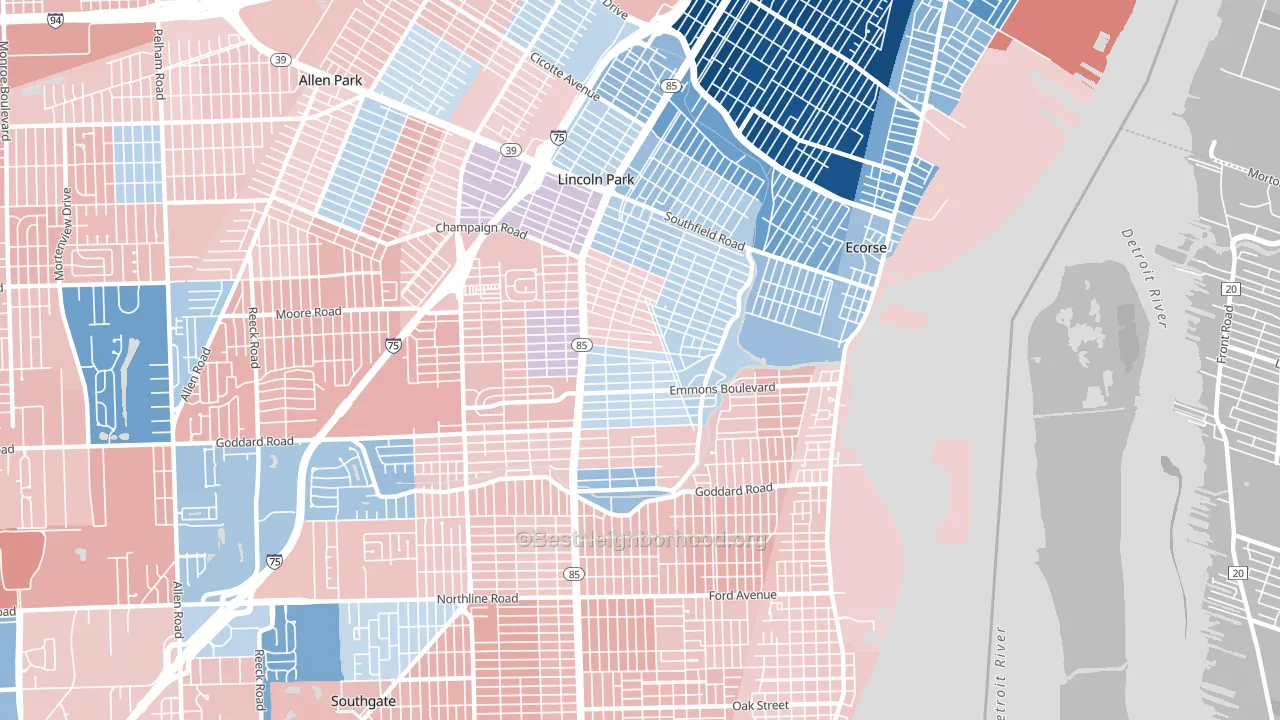
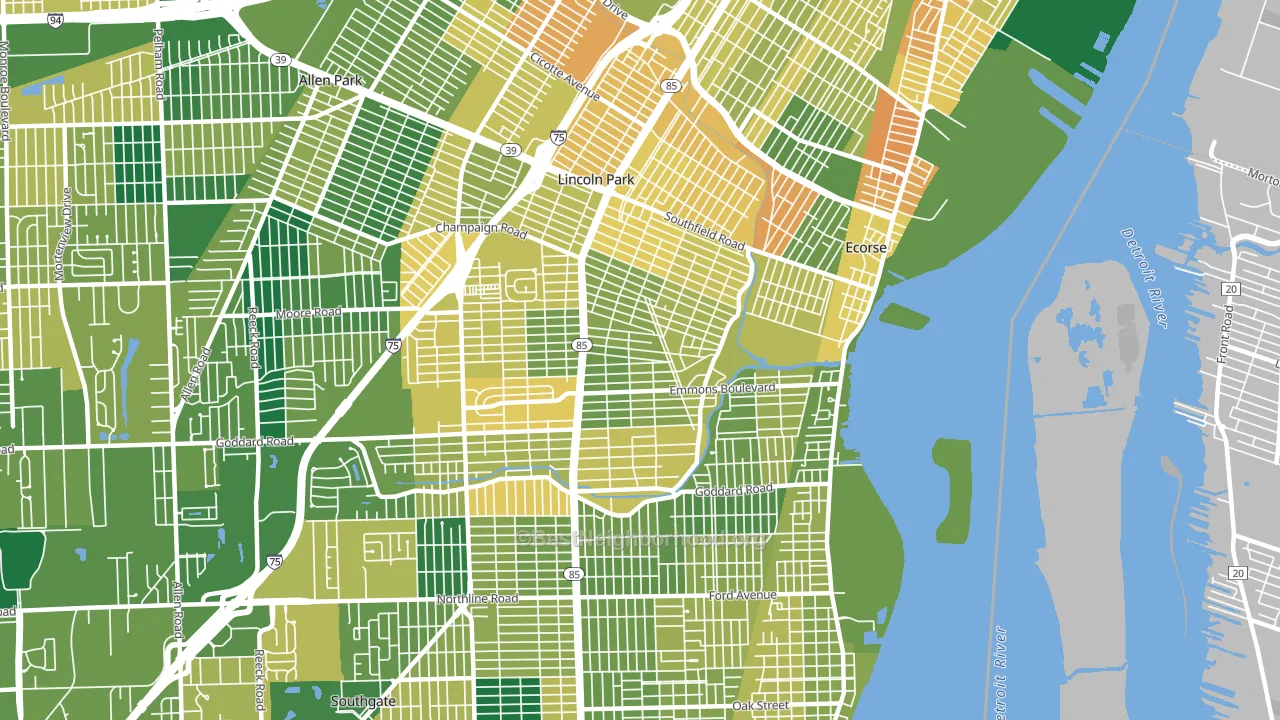
About 71% of adults in Emmons Orchard typically vote, above the U.S. average of about 62%. Among adults in Emmons Orchard, ~34% vote Democratic, ~37% Republican, and ~29% don't vote. The map below shows estimated turnout by block group.
How Emmons Orchard compares
Among neighborhoods within 5 miles, Emmons Orchard leans more Republican than 3 of 5 neighbors.
Politically, Emmons Orchard sits close to the rest of Michigan.
Why Emmons Orchard leans the way it does
Density, race composition, education, and family structure all sit close to their national averages in Emmons Orchard. The lean here lands roughly where demographic data alone would predict.
Renting and voter turnout
Places with homeowner-heavy households tend to turn out at a higher rate; Emmons Orchard, Lincoln Park, MI sits in the bottom quarter nationally on this measure.
Why turnout in Emmons Orchard looks the way it does
Turnout in Emmons Orchard sits close to the national pattern. Routine healthcare access, homeownership, education, and food security all land near their national averages here. Learn more about the findings and methodology on the political spectrum map.
Nearby Neighborhoods
- Mount Carmel, Wyandotte, MI R+7
- Fordville, Southgate, MI R+8
- Downtown Wyandotte, Wyandotte, MI Even
- Boynton, Detroit, MI D+85
- Snow Woods, Dearborn, MI Even
- Southwestern Outer Drive, Dearborn, MI D+3
- Springwells, Detroit, MI D+29
- East Downtown Dearborn, Dearborn, MI R+20
- Southwest Detroit, Detroit, MI D+28
- West Downtown Dearborn, Dearborn, MI D+8
Neighborhoods with Similar Populations
- Forest Park, Portland, OR D+52
- Ashburn Village, Ashburn, VA D+26
- Green Haven, Pasadena, MD R+13
- Ballard, Seattle, WA D+73
- Morris Park, Bronx, NY Even
- Midtown, Houston, TX D+42
- Love Field Area, Dallas, TX D+36
- Four Corners, Antioch, TN D+27
- Springwells, Detroit, MI D+29
- Mt Pleasant, Cleveland, OH D+87
Sources and methodology
Precinct-level voting records used to fit the model come from Michigan Department of State, Elections, distributed by the Voting and Election Science Team. Demographic inputs come from the U.S. Census Bureau (ACS 5-year estimates and the 2020 Decennial Census). Health and environmental inputs come from the CDC (PLACES and the Environmental Justice Index). Land cover comes from the USGS and EPA. Election-day and lead-up weather come from PRISM 4km daily grids and the NOAA Global Historical Climatology Network. Mail-voting and election-administration patterns come from the MIT Election Lab's Survey of the Performance of American Elections. Block-group crime detail comes from CrimeGrade. Internet data and modeling support provided by ISPreports.org.
Modeling and analysis by the BestNeighborhood data science team. Full methodology and findings: political spectrum map.
Methodology reviewed by the BestNeighborhood data team. Last updated May 2026.