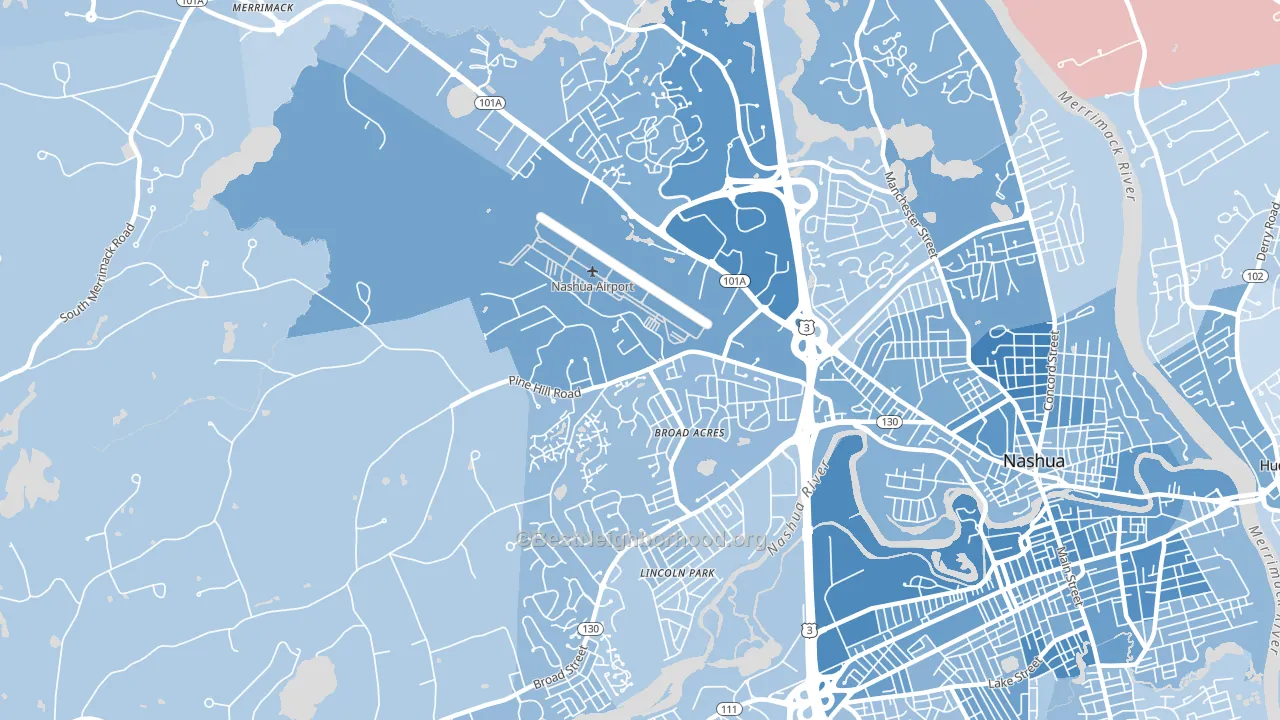
Northwest Nashua leans Democratic by roughly 22 points: about 61% of voters vote Democratic and 39% Republican. These figures are model estimates: New Hampshire did not have precinct-level voting records available for training, so the numbers above come from demographic and health features rather than local ground truth.
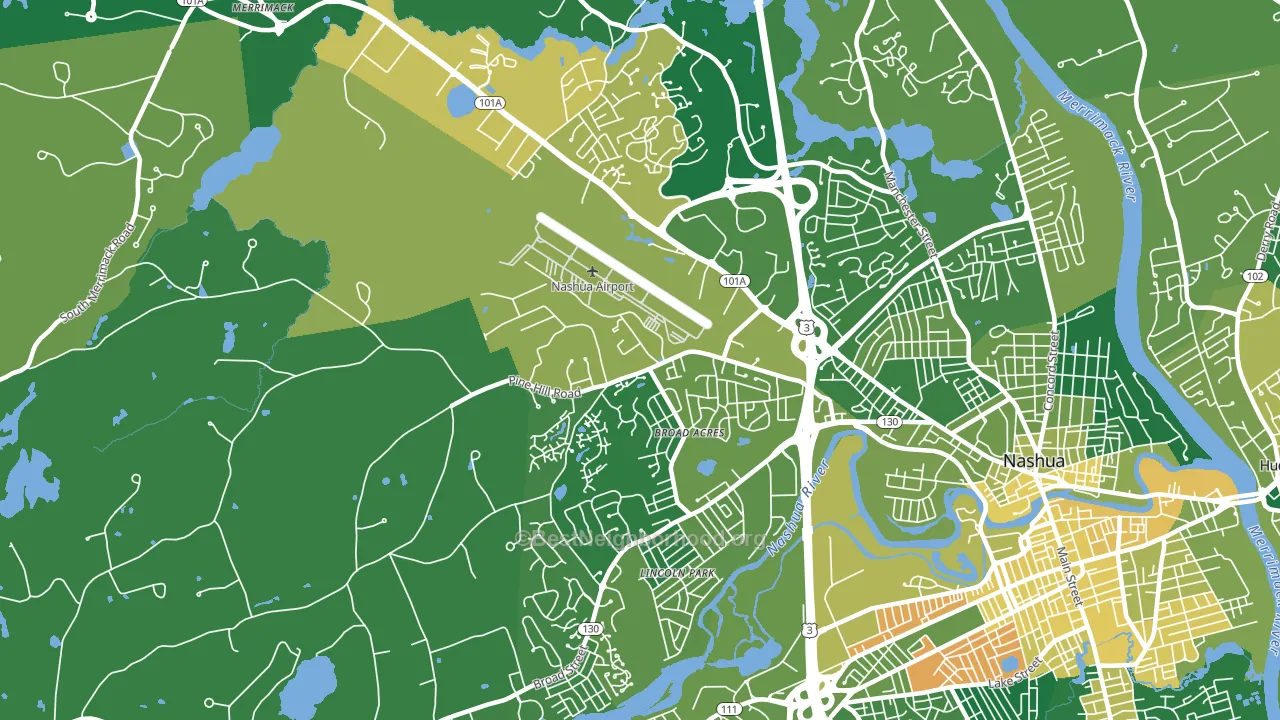
About 76% of adults in Northwest Nashua typically vote, above the U.S. average of about 62%. Among adults in Northwest Nashua, ~46% vote Democratic, ~29% Republican, and ~25% don't vote. The map below shows estimated turnout by block group.
How Northwest Nashua compares
Among neighborhoods within 5 miles, Northwest Nashua leans more Democratic than 3 of 6 neighbors.
Northwest Nashua runs about 20 points more Democratic than New Hampshire as a whole.
Politics vary noticeably by block within Northwest Nashua. The northeast side is the most Democratic-leaning (D+33) and the southeast side is the least Democratic-leaning (D+15), a spread of about 19 points.
Why Northwest Nashua leans the way it does
Density, race composition, education, and family structure all sit close to their national averages in Northwest Nashua. None of them point strongly toward either party.
Food insecurity and voter turnout
Places with low food insecurity tend to turn out at a higher rate; Northwest Nashua, Nashua, NH sits in the bottom quarter nationally on this measure. Food insecurity does not directly drive turnout; it reflects economic hardship, which lines up with lower voting.
Why turnout in Northwest Nashua looks the way it does
Turnout in Northwest Nashua sits close to the national pattern. Routine healthcare access, homeownership, education, and food security all land near their national averages here. Learn more about the findings and methodology on the political spectrum map.
Nearby Neighborhoods
- North End, Nashua, NH D+20
- Mine Falls Park, Nashua, NH D+17
- Nashua Historic District, Nashua, NH D+24
- Downtown Nashua, Nashua, NH D+31
- South End, Nashua, NH D+16
- Southeast Nashua, Nashua, NH D+26
- Pawtucketville, Lowell, MA D+15
- Highlands, Manchester, NH D+11
- The Acre, Lowell, MA D+42
- Centralville, Lowell, MA D+20
Neighborhoods with Similar Populations
- Lee-Miles, Cleveland, OH D+88
- Brooklyn-Curtis Bay, Brooklyn, MD D+37
- Greenfield, Detroit, MI D+87
- The Avenues, Salt Lake City, UT D+64
- Mt Pleasant, Cleveland, OH D+87
- City Center, Glendale, CA D+18
- Love Field Area, Dallas, TX D+36
- Midtown, Houston, TX D+42
- Ballard, Seattle, WA D+73
- Green Haven, Pasadena, MD R+13
Sources and methodology
Precinct-level voting records used to fit the model come from New Hampshire Secretary of State, Elections Division, distributed by the Voting and Election Science Team. Demographic inputs come from the U.S. Census Bureau (ACS 5-year estimates and the 2020 Decennial Census). Health and environmental inputs come from the CDC (PLACES and the Environmental Justice Index). Land cover comes from the USGS and EPA. Election-day and lead-up weather come from PRISM 4km daily grids and the NOAA Global Historical Climatology Network. Mail-voting and election-administration patterns come from the MIT Election Lab's Survey of the Performance of American Elections. Block-group crime detail comes from CrimeGrade. Internet data and modeling support provided by ISPreports.org.
Modeling and analysis by the BestNeighborhood data science team. NH did not have precinct-level voting records available for training, so the figures here come from extrapolation across demographic, health, and land-use features rather than local ground truth. Full methodology and findings: political spectrum map.
Methodology reviewed by the BestNeighborhood data team. Last updated May 2026.