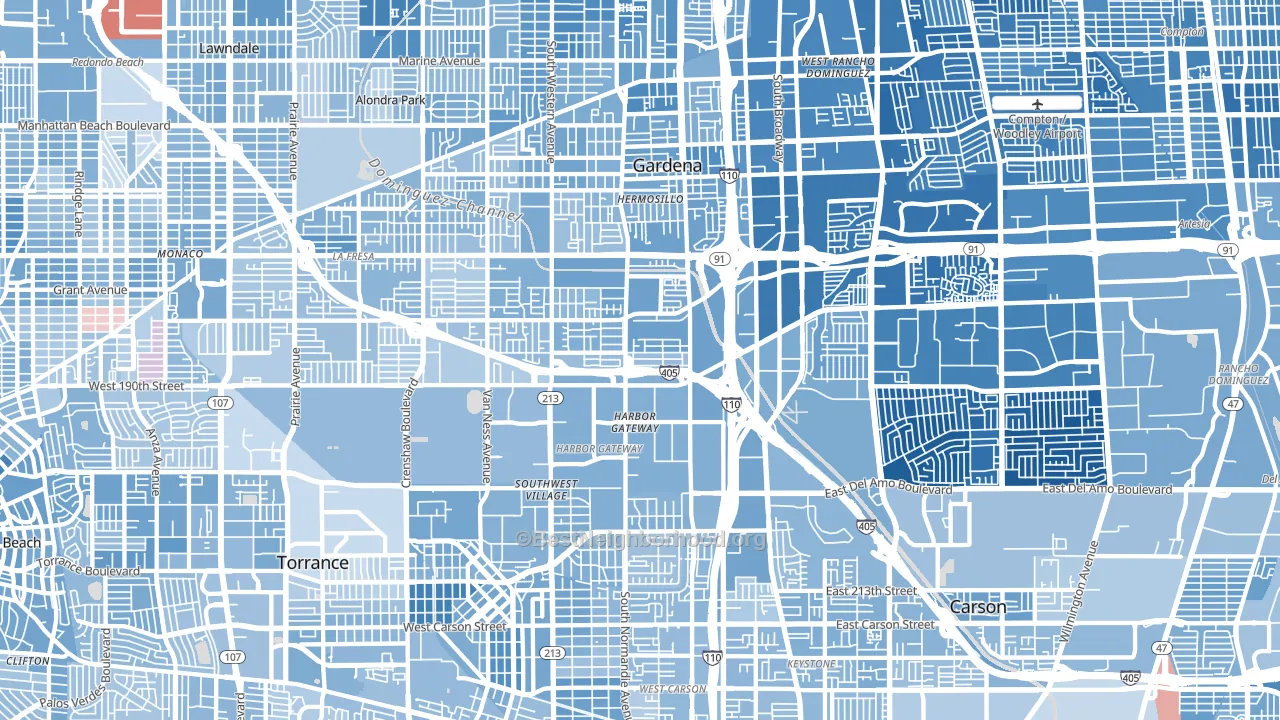
Harbor Gateway leans heavily Democratic by roughly 34 points: about 67% of voters vote Democratic and 33% Republican.
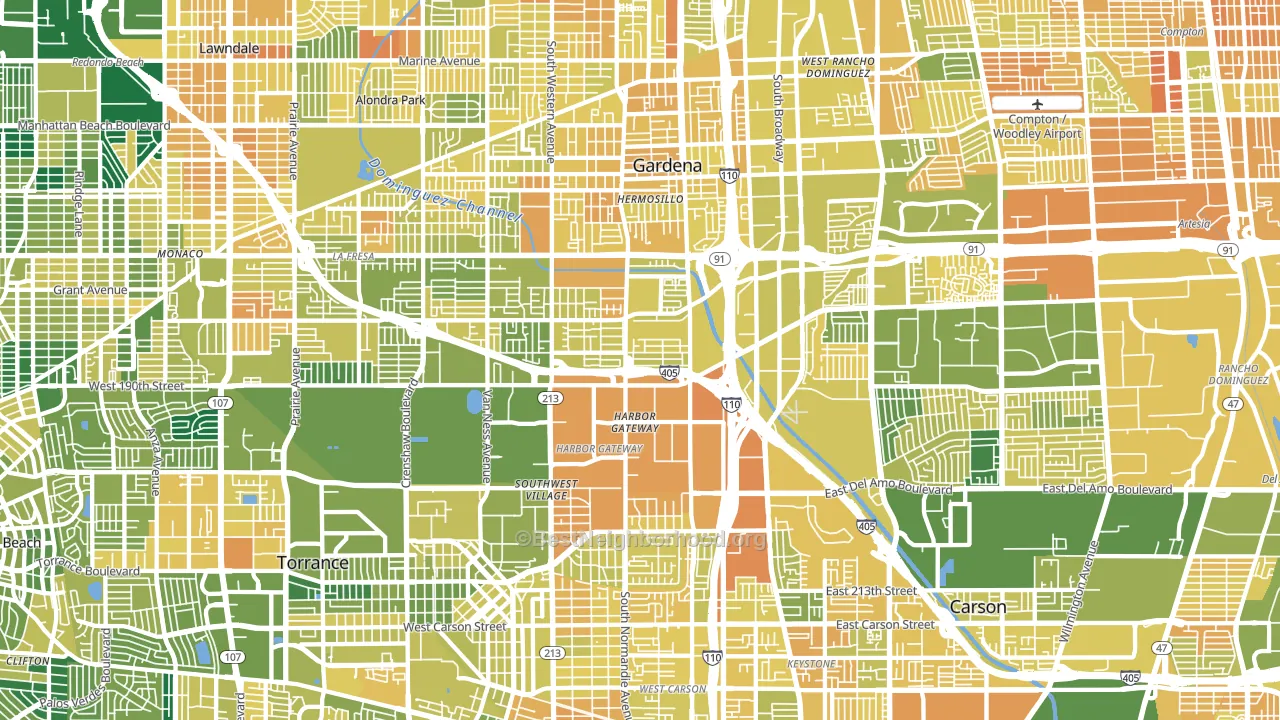
About 45% of adults in Harbor Gateway typically vote, below the U.S. average of about 62%. Among adults in Harbor Gateway, ~30% vote Democratic, ~15% Republican, and ~55% don't vote. The map below shows estimated turnout by block group.
How Harbor Gateway compares
Among neighborhoods within 5 miles, Harbor Gateway leans more Democratic than 5 of 8 neighbors.
Harbor Gateway runs about 15 points more Democratic than California as a whole.
Politics vary noticeably by block within Harbor Gateway. The northeast side is the most Democratic-leaning (D+45) and the south side is the least Democratic-leaning (D+24), a spread of about 21 points.
Why Harbor Gateway leans the way it does
This analysis examined 14,881 data points per neighborhood to find what predicts political lean and turnout. The items below are a few correlations that stood out for Harbor Gateway, not a ranked or complete list of what matters most.
Dense areas vote Democratic. More than 99% of residents in Harbor Gateway live in densely developed areas, about 64 points above the U.S. average of 36%.
Paved land cover and Democratic lean
Places with extensive paved surfaces tend to lean Democratic; Harbor Gateway, Torrance, CA sits in the top tenth nationally on this measure. Paved ground does not change how people vote; it mostly reflects how urban and built-up a place is.
Why turnout in Harbor Gateway looks the way it does
Crowded housing lines up with lower turnout. About 16% of homes in Harbor Gateway have more than one occupant per room, above 97% of neighborhoods. Learn more about the findings and methodology on the political spectrum map.
Nearby Neighborhoods
- North Torrance, Torrance, CA D+20
- Old Town, Torrance, CA D+32
- Alondra Park, Lawndale, CA D+29
- West Rancho Domingues, Compton, CA D+61
- South East Torrance, Torrance, CA D+16
- West Torrance, Torrance, CA D+22
- Rancho Dominguez, Compton, CA D+39
- Athens, West Athens, CA D+63
- Walteria, Torrance, CA D+19
- North West Long Beach, Long Beach, CA D+49
Neighborhoods with Similar Populations
- East Reno, Reno, NV D+14
- Middle Village, Queens, NY R+22
- Wheaton-Glenmont, Wheaton, MD D+51
- Oak Lane, Philadelphia, PA D+87
- Mar Vista, Los Angeles, CA D+49
- Sycamore, Fort Worth, TX D+39
- North Cheyenne, Las Vegas, NV Even
- St Charles, Waldorf, MD D+66
- M Streets, Dallas, TX D+25
- Uptown, Chicago, IL D+77
Sources and methodology
Precinct-level voting records used to fit the model come from California Secretary of State, Elections, distributed by the Voting and Election Science Team. Demographic inputs come from the U.S. Census Bureau (ACS 5-year estimates and the 2020 Decennial Census). Health and environmental inputs come from the CDC (PLACES and the Environmental Justice Index). Land cover comes from the USGS and EPA. Election-day and lead-up weather come from PRISM 4km daily grids and the NOAA Global Historical Climatology Network. Mail-voting and election-administration patterns come from the MIT Election Lab's Survey of the Performance of American Elections. Block-group crime detail comes from CrimeGrade. Internet data and modeling support provided by ISPreports.org.
Modeling and analysis by the BestNeighborhood data science team. Full methodology and findings: political spectrum map.
Methodology reviewed by the BestNeighborhood data team. Last updated May 2026.