Howard Park is a Democratic stronghold. About 93% of voters here vote Democratic and 7% Republican.
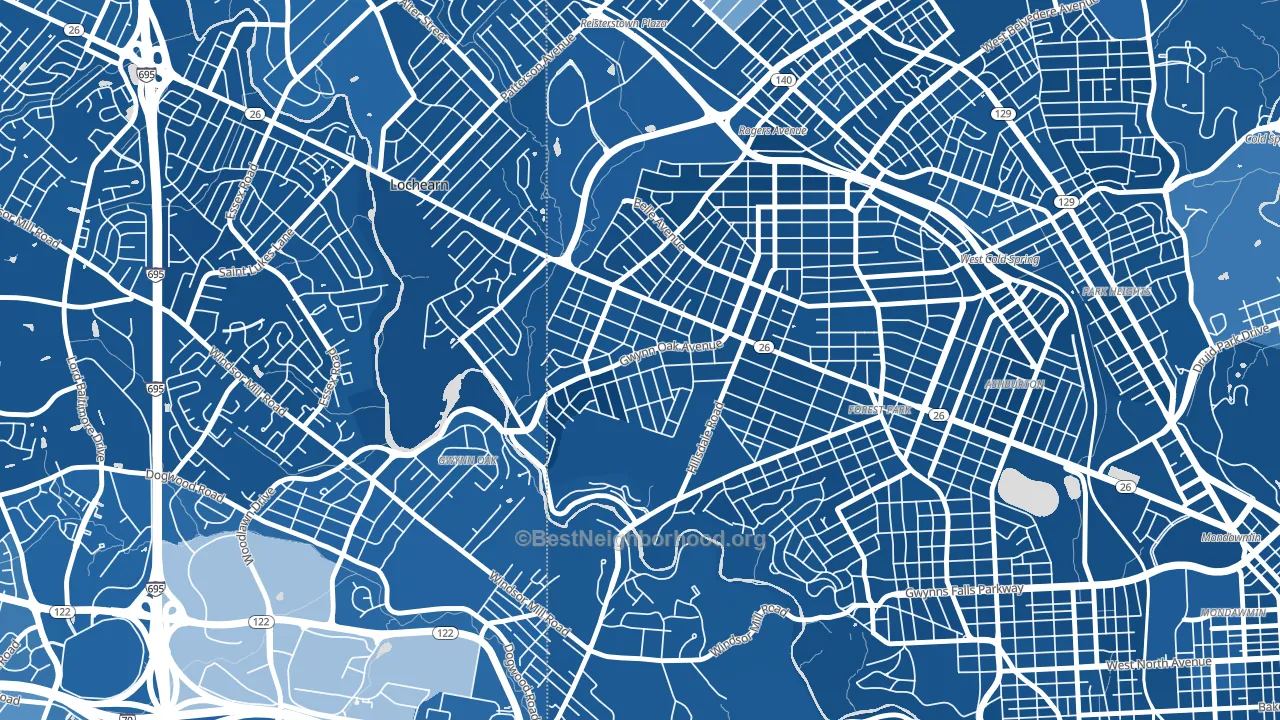
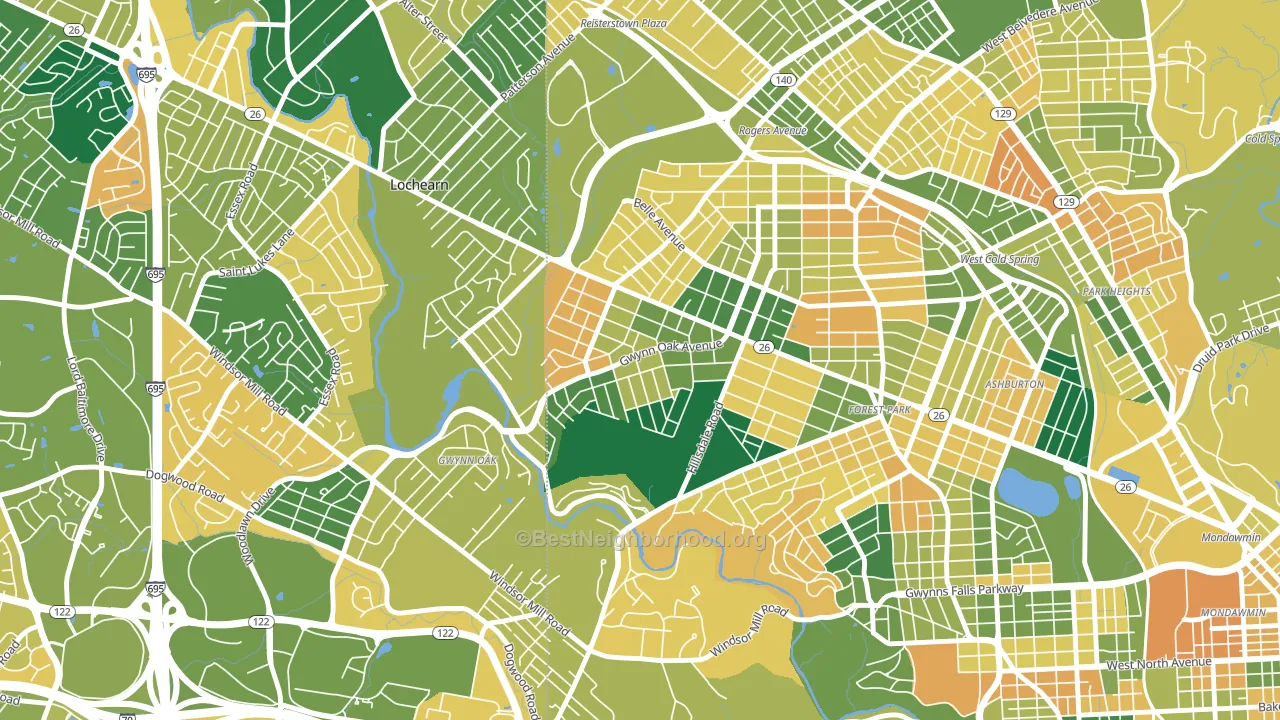
About 69% of adults in Howard Park typically vote, above the U.S. average of about 62%. Among adults in Howard Park, ~64% vote Democratic, ~5% Republican, and ~31% don't vote. The map below shows estimated turnout by block group.
How Howard Park compares
Among neighborhoods within 5 miles, Howard Park leans more Democratic than 19 of 27 neighbors.
Howard Park runs about 57 points more Democratic than Maryland as a whole.
Why Howard Park leans the way it does
This analysis examined 14,881 data points per neighborhood to find what predicts political lean and turnout. The items below are a few correlations that stood out for Howard Park, not a ranked or complete list of what matters most.
Areas with many never-married adults vote Democratic. About 47% of adults in Howard Park have never been married, about 18 points above the U.S. average of 29%.
Cancer-screening access and voter turnout
Places with high colon-cancer-screening access tend to turn out at a higher rate; Howard Park, Gwynn Oak, MD sits in the top quarter nationally on this measure. Cancer screening does not drive turnout; it reflects income, insurance, and healthcare access.
Why turnout in Howard Park looks the way it does
Turnout in Howard Park sits close to the national pattern. Routine healthcare access, homeownership, education, and food security all land near their national averages here. Learn more about the findings and methodology on the political spectrum map.
Nearby Neighborhoods
- Forest Park, Baltimore, MD D+86
- Winsor Hills, Baltimore, MD D+87
- Pimlico, Baltimore, MD D+85
- Woodmoor, Lochearn, MD D+86
- Park Heights, Baltimore, MD D+86
- Glen-Fallstaff, Baltimore, MD D+49
- Hunting Ridge, Baltimore, MD D+86
- Edmondson Heights, Woodlawn, MD D+81
- Mondawin-Walbrook, Baltimore, MD D+86
- Cheswolde, Baltimore, MD D+9
Neighborhoods with Similar Populations
- Eastlake, Seattle, WA D+76
- Bandini, Commerce, CA D+37
- Marlyville, New Orleans, LA D+50
- Culebra Park, San Antonio, TX D+27
- Briarcliffe, Glenolden, PA D+15
- Waltherson, Baltimore, MD D+75
- La Sierra Hills, Riverside, CA Even
- Indian Hills, Grand Prairie, TX D+10
- Downtown Lexington, Lexington, KY D+55
- Midtown-Nashville, Nashville, TN D+32
Sources and methodology
Precinct-level voting records used to fit the model come from Maryland State Board of Elections, distributed by the Voting and Election Science Team. Demographic inputs come from the U.S. Census Bureau (ACS 5-year estimates and the 2020 Decennial Census). Health and environmental inputs come from the CDC (PLACES and the Environmental Justice Index). Land cover comes from the USGS and EPA. Election-day and lead-up weather come from PRISM 4km daily grids and the NOAA Global Historical Climatology Network. Mail-voting and election-administration patterns come from the MIT Election Lab's Survey of the Performance of American Elections. Block-group crime detail comes from CrimeGrade. Internet data and modeling support provided by ISPreports.org.
Modeling and analysis by the BestNeighborhood data science team. Full methodology and findings: political spectrum map.
Methodology reviewed by the BestNeighborhood data team. Last updated May 2026.