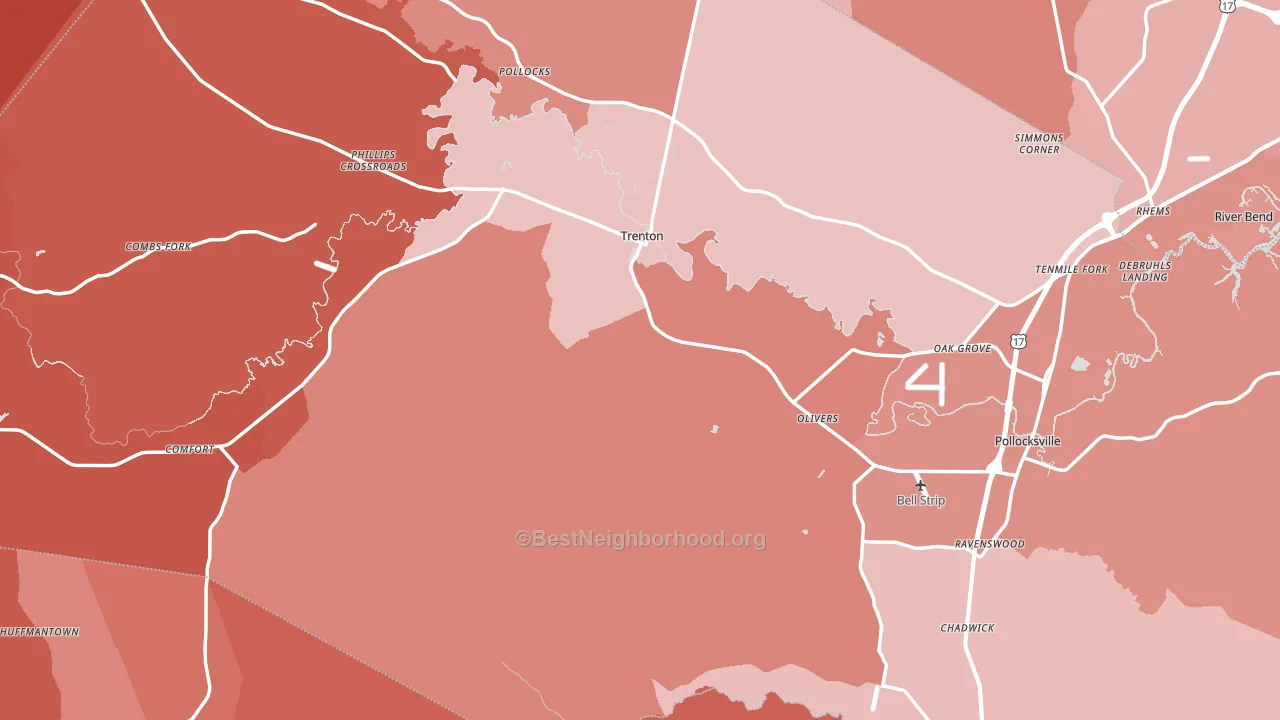
Jones County leans Republican by roughly 24 points: about 38% of voters vote Democratic and 62% Republican.
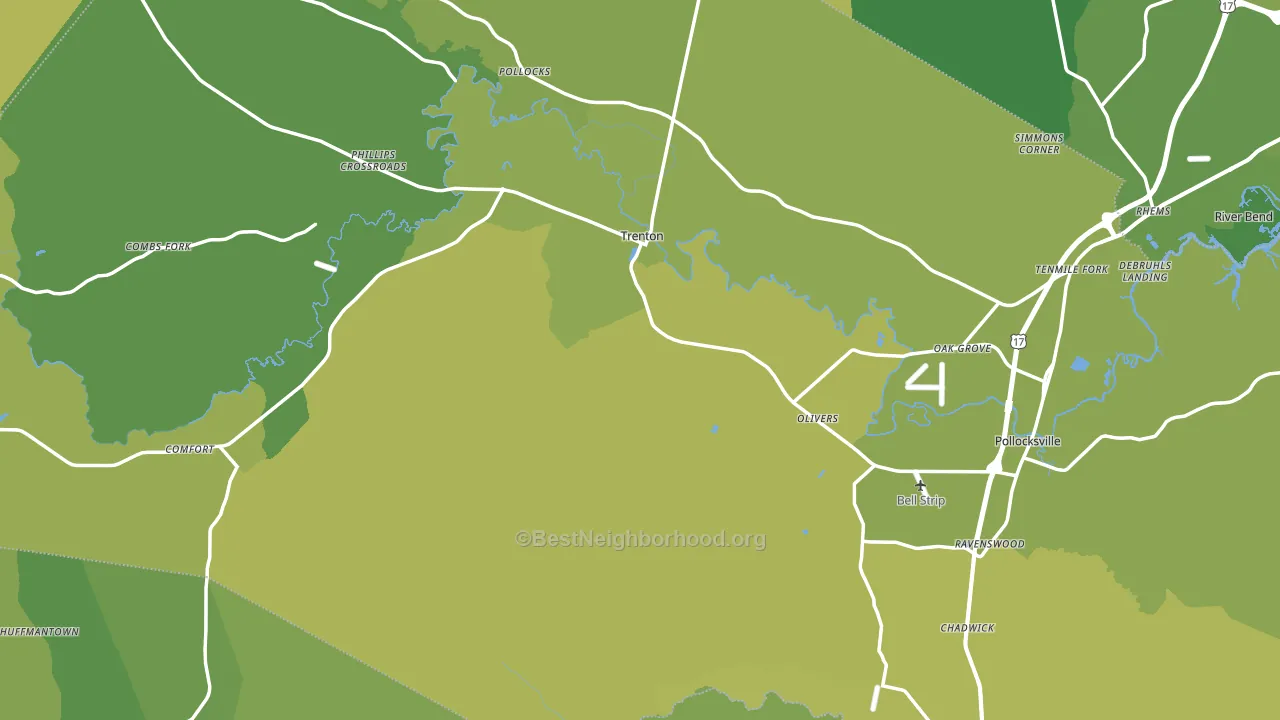
About 69% of adults in Jones County typically vote, above the U.S. average of about 62%. Among adults in Jones County, ~26% vote Democratic, ~43% Republican, and ~31% don't vote. The map below shows estimated turnout by block group.
How Jones County compares
Among counties within 50 miles, Jones County leans more Republican than 8 of 11 neighbors.
Jones County runs about 21 points more Republican than North Carolina as a whole.
Politics vary noticeably by city within Jones County. The southwest side is the most Republican-leaning (R+54) and the north side is the least Republican-leaning (R+6), a spread of about 47 points.
Why Jones County leans the way it does
This analysis examined 14,881 data points per county to find what predicts political lean and turnout. The items below are a few correlations that stood out for Jones County, not a ranked or complete list of what matters most.
Rural areas vote Republican. About 4% of residents in Jones County live in densely developed areas, about 22 points below the North Carolina average of 27%.
Paved land cover and Republican lean
Places with little paved surface tend to lean Republican; Jones County, NC sits in the bottom tenth nationally on this measure. Paved ground does not change how people vote; it mostly reflects how urban and built-up a place is.
Why turnout in Jones County looks the way it does
Areas with strong routine healthcare access turn out at higher rates. Jones County is in the top quarter nationally for routine-care measures such as insurance coverage, preventive screenings, and dental visits. The dental-visit rate here is about 58%, below 58% of counties. Learn more about the findings and methodology on the political spectrum map.
Nearby Counties
- Craven County, NC R+15
- Onslow County, NC R+23
- Lenoir County, NC Even
- Pamlico County, NC R+37
- Duplin County, NC R+23
- Greene County, NC R+15
- Carteret County, NC R+35
- Pitt County, NC D+17
- Beaufort County, NC R+24
- Wayne County, NC R+7
Counties with Similar Populations
- Forest County, WI R+33
- Terrell County, GA D+18
- Pratt County, KS R+53
- Johnson County, GA R+39
- Montmorency County, MI R+42
- McLean County, KY R+58
- Seminole County, GA R+30
- Somervell County, TX R+67
- Claiborne County, MS D+61
- Davis County, IA R+59
Sources and methodology
Precinct-level voting records used to fit the model come from North Carolina State Board of Elections, distributed by the Voting and Election Science Team. Demographic inputs come from the U.S. Census Bureau (ACS 5-year estimates and the 2020 Decennial Census). Health and environmental inputs come from the CDC (PLACES and the Environmental Justice Index). Land cover comes from the USGS and EPA. Election-day and lead-up weather come from PRISM 4km daily grids and the NOAA Global Historical Climatology Network. Mail-voting and election-administration patterns come from the MIT Election Lab's Survey of the Performance of American Elections. Block-group crime detail comes from CrimeGrade. Internet data and modeling support provided by ISPreports.org.
Modeling and analysis by the BestNeighborhood data science team. Full methodology and findings: political spectrum map.
Methodology reviewed by the BestNeighborhood data team. Last updated May 2026.