Somervell County is a Republican stronghold. About 16% of voters here vote Democratic and 84% Republican.
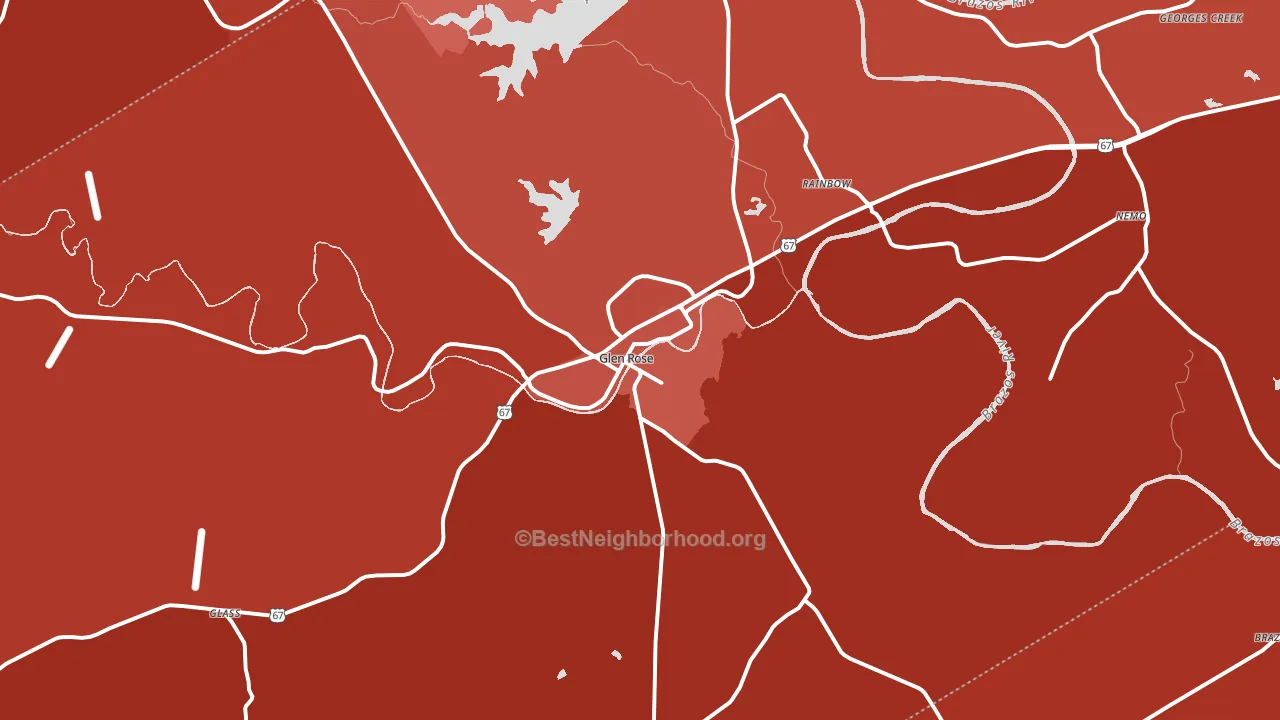
About 79% of adults in Somervell County typically vote, above the U.S. average of about 62%. Among adults in Somervell County, ~13% vote Democratic, ~66% Republican, and ~21% don't vote. The map below shows estimated turnout by block group.
How Somervell County compares
Among counties within 50 miles, Somervell County leans more Republican than 8 of 9 neighbors.
Somervell County runs about 53 points more Republican than Texas as a whole.
Politics vary noticeably by city within Somervell County. The southeast side is the most Republican-leaning (R+75) and the north side is the least Republican-leaning (R+62), a spread of about 13 points.
Why Somervell County leans the way it does
This analysis examined 14,881 data points per county to find what predicts political lean and turnout. The items below are a few correlations that stood out for Somervell County, not a ranked or complete list of what matters most.
Areas with many family households vote Republican. About 73% of households in Somervell County are family households, about 7 points above the U.S. average of 67%.
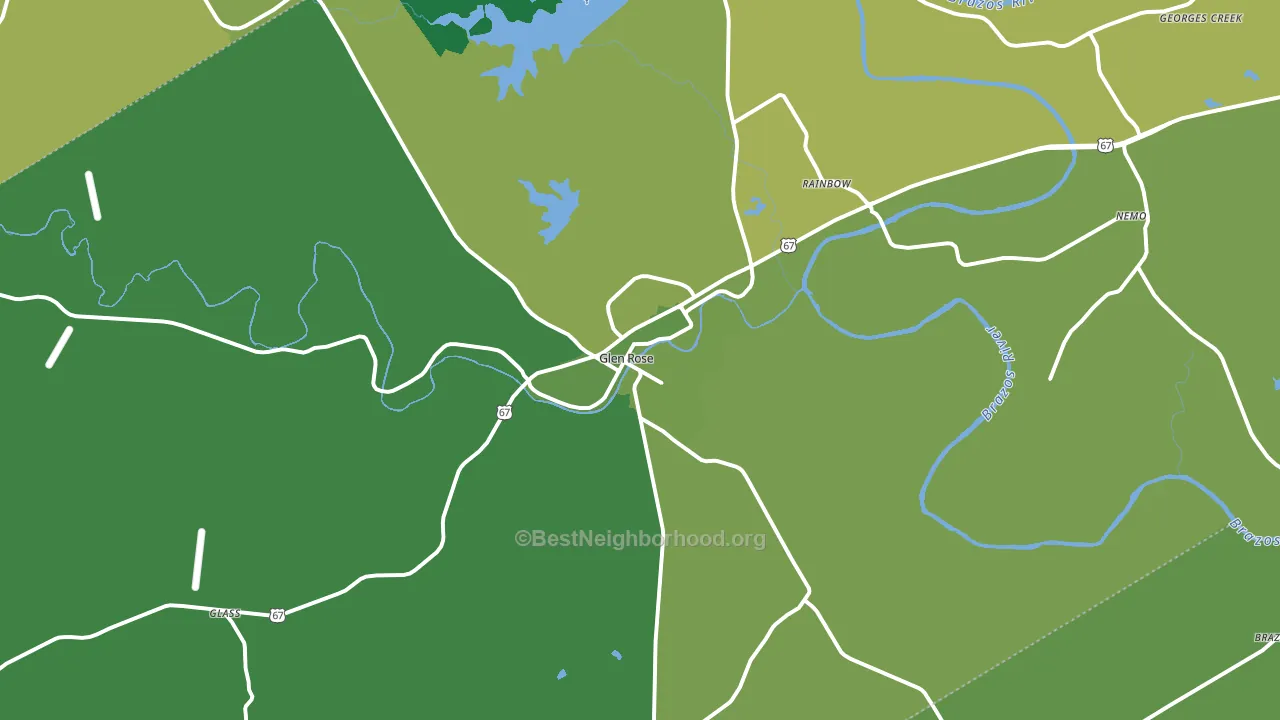
Population density and Republican lean
Places with low population density tend to lean Republican; Somervell County, TX sits below the national average on this measure.
Why turnout in Somervell County looks the way it does
Areas with limited routine healthcare access turn out at lower rates. Somervell County is in the bottom quarter nationally for routine-care measures such as insurance coverage, preventive screenings, and dental visits. Learn more about the findings and methodology on the political spectrum map.
Nearby Counties
- Hood County, TX R+61
- Erath County, TX R+55
- Bosque County, TX R+63
- Johnson County, TX R+50
- Hill County, TX R+58
- Hamilton County, TX R+69
- Parker County, TX R+62
- Palo Pinto County, TX R+62
- Tarrant County, TX D+3
- Comanche County, TX R+65
Counties with Similar Populations
- Johnson County, GA R+39
- Terrell County, GA D+18
- Forest County, WI R+33
- Jones County, NC R+24
- Clinton County, KY R+72
- Pratt County, KS R+53
- Montmorency County, MI R+42
- McLean County, KY R+58
- Seminole County, GA R+30
- Claiborne County, MS D+61
Sources and methodology
Precinct-level voting records used to fit the model come from Texas Secretary of State, Elections Division, distributed by the Voting and Election Science Team. Demographic inputs come from the U.S. Census Bureau (ACS 5-year estimates and the 2020 Decennial Census). Health and environmental inputs come from the CDC (PLACES and the Environmental Justice Index). Land cover comes from the USGS and EPA. Election-day and lead-up weather come from PRISM 4km daily grids and the NOAA Global Historical Climatology Network. Mail-voting and election-administration patterns come from the MIT Election Lab's Survey of the Performance of American Elections. Block-group crime detail comes from CrimeGrade. Internet data and modeling support provided by ISPreports.org.
Modeling and analysis by the BestNeighborhood data science team. Full methodology and findings: political spectrum map.
Methodology reviewed by the BestNeighborhood data team. Last updated May 2026.