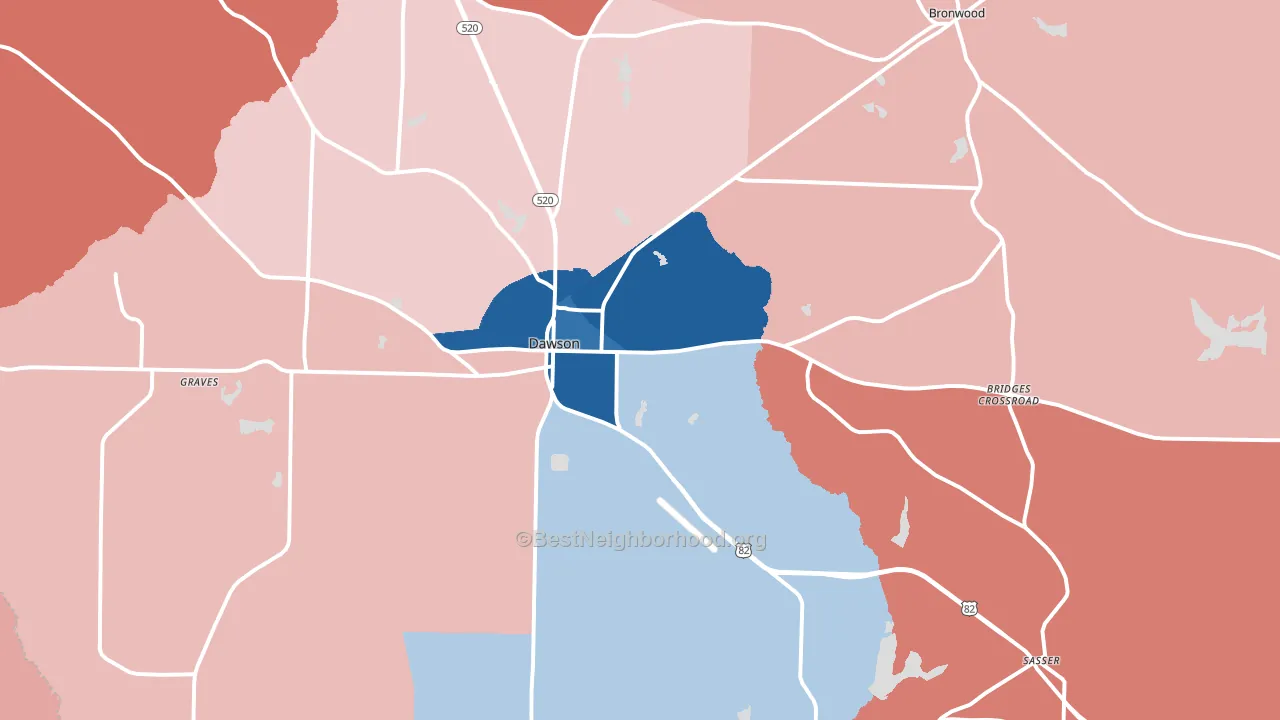
Terrell County leans Democratic by roughly 18 points: about 59% of voters vote Democratic and 41% Republican.
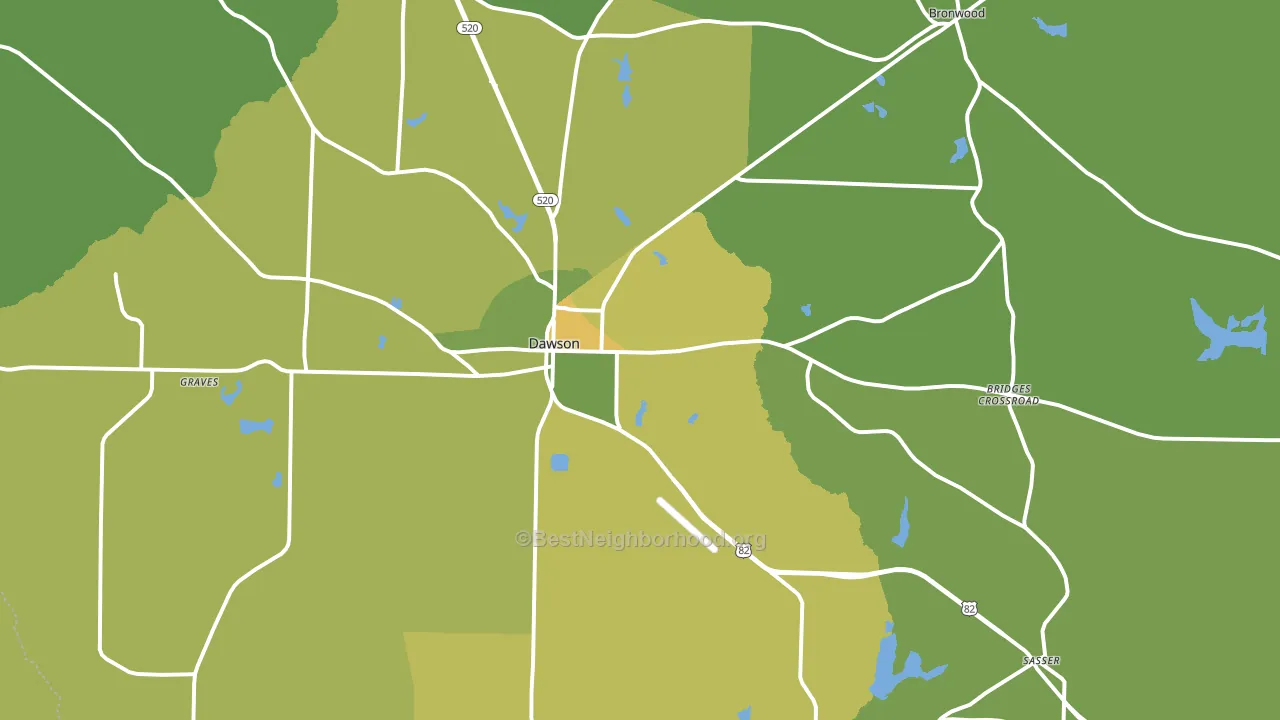
About 72% of adults in Terrell County typically vote, above the U.S. average of about 62%. Among adults in Terrell County, ~42% vote Democratic, ~29% Republican, and ~29% don't vote. The map below shows estimated turnout by block group.
How Terrell County compares
Among counties within 50 miles, Terrell County leans more Democratic than 18 of 21 neighbors.
Terrell County runs about 20 points more Democratic than Georgia as a whole. Georgia is roughly evenly split, and Terrell County sits clearly on the Democratic side.
Politics vary noticeably by city within Terrell County. The south side runs the most Democratic (D+40) and the northwest side runs the most Republican (R+27), a spread of about 67 points.
Why Terrell County leans the way it does
This analysis examined 14,881 data points per county to find what predicts political lean and turnout. The items below are a few correlations that stood out for Terrell County, not a ranked or complete list of what matters most.
Areas with many never-married adults vote Democratic. About 35% of adults in Terrell County have never been married, modestly above similar-sized counties (around 28%). Terrell County runs against the grain of Georgia, a Democratic-leaning outlier in a roughly evenly split state.
Park access and Republican lean
Places with low park coverage tend to lean Republican; Terrell County, GA sits in the bottom tenth nationally on this measure. Park access does not change how people vote; it tends to track denser, higher-income areas.
Why turnout in Terrell County looks the way it does
Areas with limited routine healthcare access turn out at lower rates. Terrell County is in the bottom quarter nationally for routine-care measures such as insurance coverage, preventive screenings, and dental visits. The dental-visit rate here is about 48%, about 8 points below the Georgia average of 56%. Learn more about the findings and methodology on the political spectrum map.
Nearby Counties
- Lee County, GA R+38
- Randolph County, GA D+3
- Dougherty County, GA D+48
- Webster County, GA R+16
- Calhoun County, GA D+13
- Sumter County, GA D+13
- Stewart County, GA D+12
- Baker County, GA R+16
- Schley County, GA R+60
- Clay County, GA D+18
Counties with Similar Populations
- Johnson County, GA R+39
- Forest County, WI R+33
- Jones County, NC R+24
- Somervell County, TX R+67
- Pratt County, KS R+53
- Montmorency County, MI R+42
- McLean County, KY R+58
- Seminole County, GA R+30
- Claiborne County, MS D+61
- Clinton County, KY R+72
Sources and methodology
Precinct-level voting records used to fit the model come from Georgia Elections Division, distributed by the Voting and Election Science Team. Demographic inputs come from the U.S. Census Bureau (ACS 5-year estimates and the 2020 Decennial Census). Health and environmental inputs come from the CDC (PLACES and the Environmental Justice Index). Land cover comes from the USGS and EPA. Election-day and lead-up weather come from PRISM 4km daily grids and the NOAA Global Historical Climatology Network. Mail-voting and election-administration patterns come from the MIT Election Lab's Survey of the Performance of American Elections. Block-group crime detail comes from CrimeGrade. Internet data and modeling support provided by ISPreports.org.
Modeling and analysis by the BestNeighborhood data science team. Full methodology and findings: political spectrum map.
Methodology reviewed by the BestNeighborhood data team. Last updated May 2026.