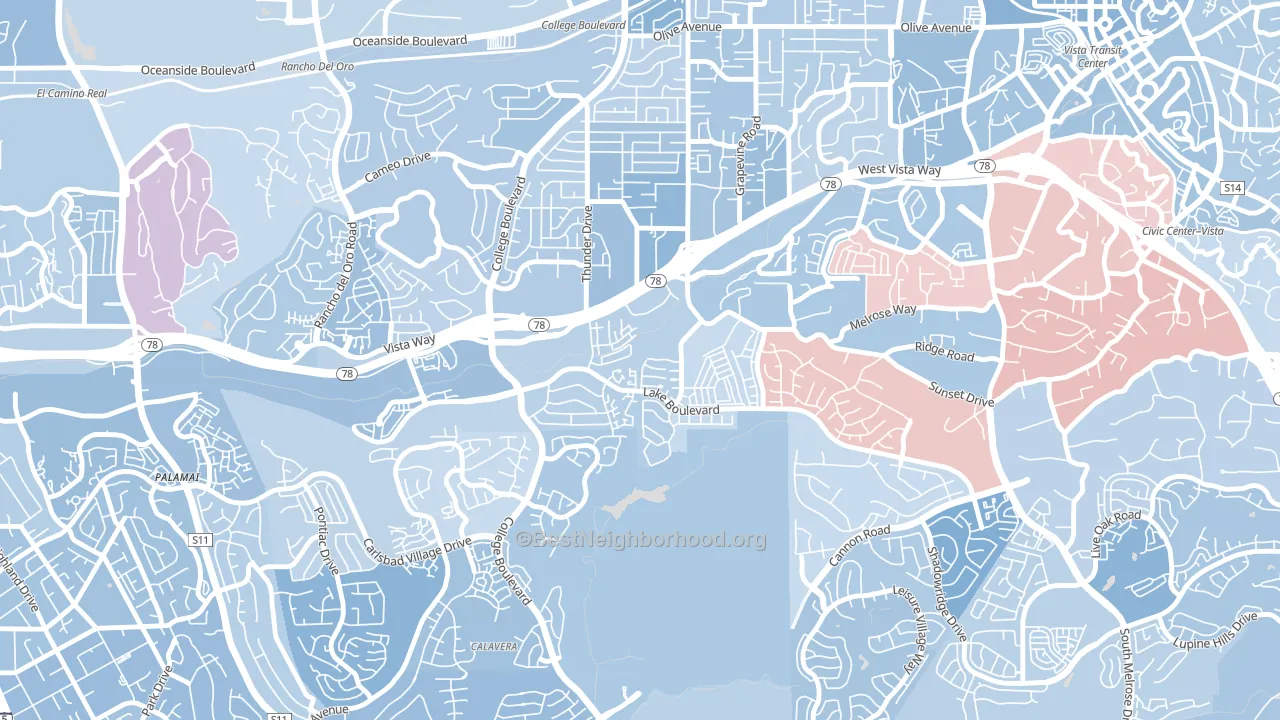
Lake is a true toss-up. About 52% of voters here vote Democratic and 48% Republican.
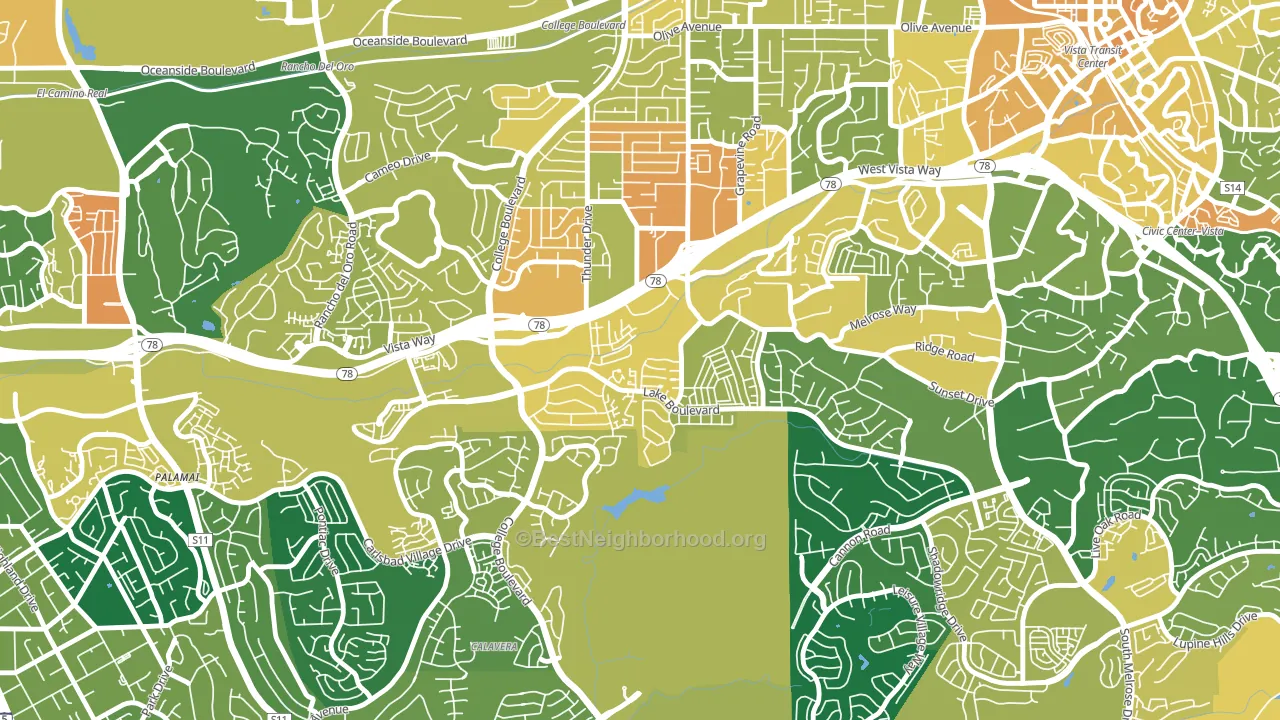
About 57% of adults in Lake typically vote, near the U.S. average of about 62%. Among adults in Lake, ~30% vote Democratic, ~27% Republican, and ~43% don't vote. The map below shows estimated turnout by block group.
How Lake compares
Among neighborhoods within 5 miles, Lake leans more Democratic than 1 of 7 neighbors.
Lake runs about 17 points more Republican than California as a whole.
Why Lake leans the way it does
Density, race composition, education, and family structure all sit close to their national averages in Lake. The lean here lands roughly where demographic data alone would predict.
Developed land and Democratic lean
Places with a heavily developed built environment tend to lean Democratic; Lake, Oceanside, CA sits in the top quarter nationally on this measure. Developed land does not change how people vote; it mostly reflects how urban a place is.
Why turnout in Lake looks the way it does
Crowded housing lines up with lower turnout. About 10% of homes in Lake have more than one occupant per room, above 92% of neighborhoods. Learn more about the findings and methodology on the political spectrum map.
Nearby Neighborhoods
- Peacock, Oceanside, CA D+10
- Ivey Ranch-Rancho del Oro, Oceanside, CA D+13
- Fire Mountain, Oceanside, CA D+19
- Downtown Carlsbad, Carlsbad, CA D+24
- San Luis Rey, Oceanside, CA D+11
- Guajome, Oceanside, CA Even
- South Oceanside, Oceanside, CA D+19
- North Valley San Diego, Oceanside, CA D+10
- East Side Capistrano, Oceanside, CA D+15
- Townsite, Oceanside, CA D+31
Neighborhoods with Similar Populations
- Redmont Park, Birmingham, AL R+10
- Catonsville Heights, Catonsville, MD D+45
- Aspen, Davis, CA D+71
- Marietta Historic District, Marietta, OH Even
- Hickman Mills, Kansas City, MO D+52
- Third Ward, Charlotte, NC D+47
- Rogers Park, Anchorage, AK D+29
- McIntosh, Newport News, VA D+47
- Garden View, Detroit, MI D+80
- Embudo Canyon, Albuquerque, NM D+20
Sources and methodology
Precinct-level voting records used to fit the model come from California Secretary of State, Elections, distributed by the Voting and Election Science Team. Demographic inputs come from the U.S. Census Bureau (ACS 5-year estimates and the 2020 Decennial Census). Health and environmental inputs come from the CDC (PLACES and the Environmental Justice Index). Land cover comes from the USGS and EPA. Election-day and lead-up weather come from PRISM 4km daily grids and the NOAA Global Historical Climatology Network. Mail-voting and election-administration patterns come from the MIT Election Lab's Survey of the Performance of American Elections. Block-group crime detail comes from CrimeGrade. Internet data and modeling support provided by ISPreports.org.
Modeling and analysis by the BestNeighborhood data science team. Full methodology and findings: political spectrum map.
Methodology reviewed by the BestNeighborhood data team. Last updated May 2026.