Waite Park is a Democratic stronghold. About 78% of voters here vote Democratic and 22% Republican.
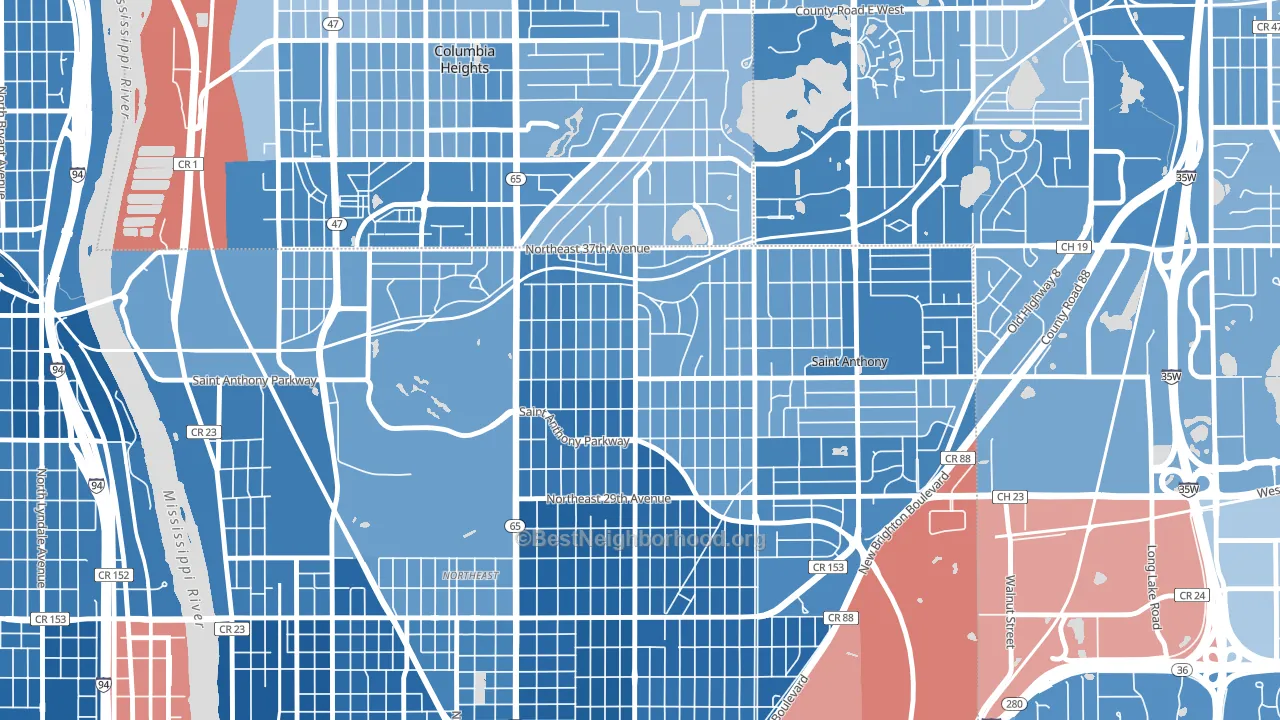
About 86% of adults in Waite Park typically vote, above the U.S. average of about 62%. Among adults in Waite Park, ~67% vote Democratic, ~19% Republican, and ~14% don't vote. The map below shows estimated turnout by block group.
How Waite Park compares
Among neighborhoods within 5 miles, Waite Park leans more Democratic than 2 of 26 neighbors.
Waite Park runs about 51 points more Democratic than Minnesota as a whole.
Politics vary noticeably by block within Waite Park. The west side is the most Democratic-leaning (D+61) and the northeast side is the least Democratic-leaning (D+48), a spread of about 14 points.
Why Waite Park leans the way it does
This analysis examined 14,881 data points per neighborhood to find what predicts political lean and turnout. The items below are a few correlations that stood out for Waite Park, not a ranked or complete list of what matters most.
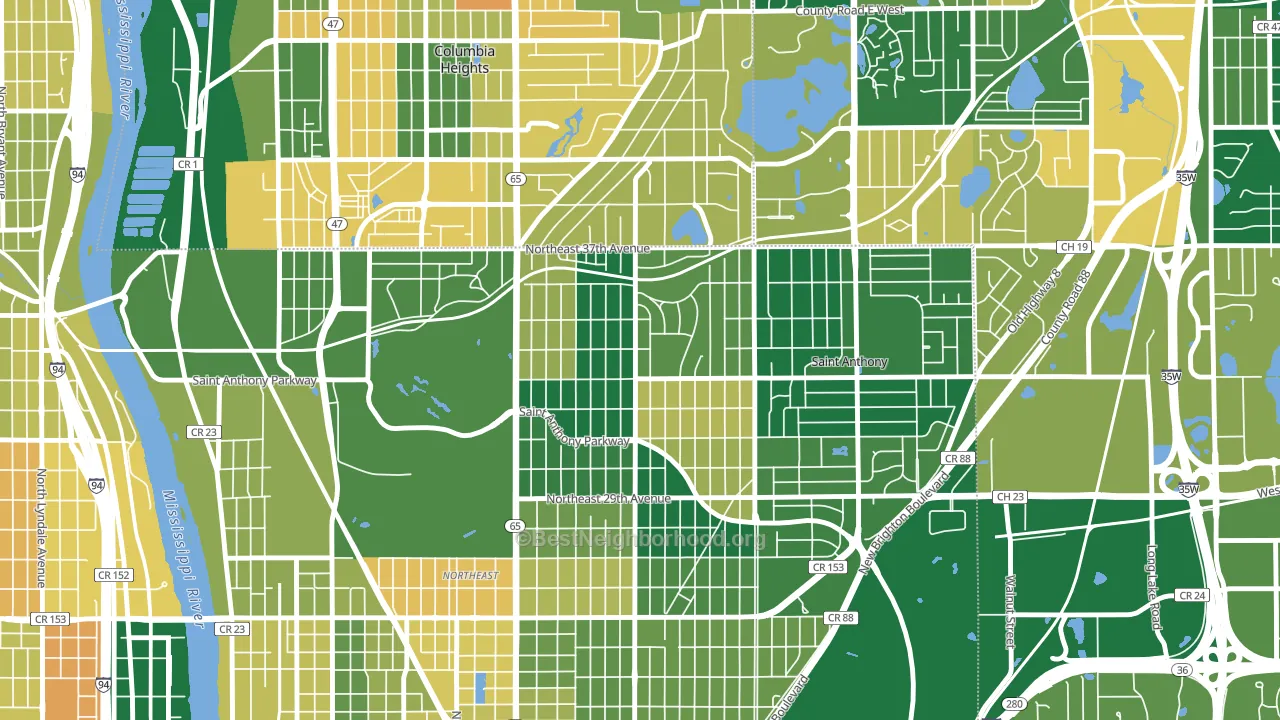
Dense areas vote Democratic. More than 99% of residents in Waite Park live in densely developed areas, about 64 points above the U.S. average of 36%.
Population density and Democratic lean
Places with high population density tend to lean Democratic; Waite Park, Minneapolis, MN sits in the top quarter nationally on this measure.
Why turnout in Waite Park looks the way it does
Homeowners vote more often than renters. About 90% of households in Waite Park own their home, about 8 points above the Minnesota average of 82%. Learn more about the findings and methodology on the political spectrum map.
Nearby Neighborhoods
- Audubon Park, Minneapolis, MN D+67
- Holland, Minneapolis, MN D+67
- Southeast Como, Minneapolis, MN D+66
- Webber-Camden, Minneapolis, MN D+61
- Lind-Bohanon, Minneapolis, MN D+56
- Hawthorne, Minneapolis, MN D+62
- Marcy Holmes, Minneapolis, MN D+59
- Folwell, Minneapolis, MN D+67
- North Loop, Minneapolis, MN D+65
- Jordan, Minneapolis, MN D+63
Neighborhoods with Similar Populations
- Memorial Square, Springfield, MA D+42
- Burlingame Gate, Burlingame, CA D+56
- Madison Park, Charlotte, NC D+24
- South Valley, Syracuse, NY D+42
- Berger, Dolton, IL D+82
- Whitehouse, Jacksonville, FL R+34
- Plum Orchard, New Orleans, LA D+84
- Ardmore, Winston-Salem, NC D+49
- Riverdale, Detroit, MI D+84
- Kilbourn Town, Milwaukee, WI D+57
Sources and methodology
Precinct-level voting records used to fit the model come from Minnesota Secretary of State, Elections, distributed by the Voting and Election Science Team. Demographic inputs come from the U.S. Census Bureau (ACS 5-year estimates and the 2020 Decennial Census). Health and environmental inputs come from the CDC (PLACES and the Environmental Justice Index). Land cover comes from the USGS and EPA. Election-day and lead-up weather come from PRISM 4km daily grids and the NOAA Global Historical Climatology Network. Mail-voting and election-administration patterns come from the MIT Election Lab's Survey of the Performance of American Elections. Block-group crime detail comes from CrimeGrade. Internet data and modeling support provided by ISPreports.org.
Modeling and analysis by the BestNeighborhood data science team. Full methodology and findings: political spectrum map.
Methodology reviewed by the BestNeighborhood data team. Last updated May 2026.