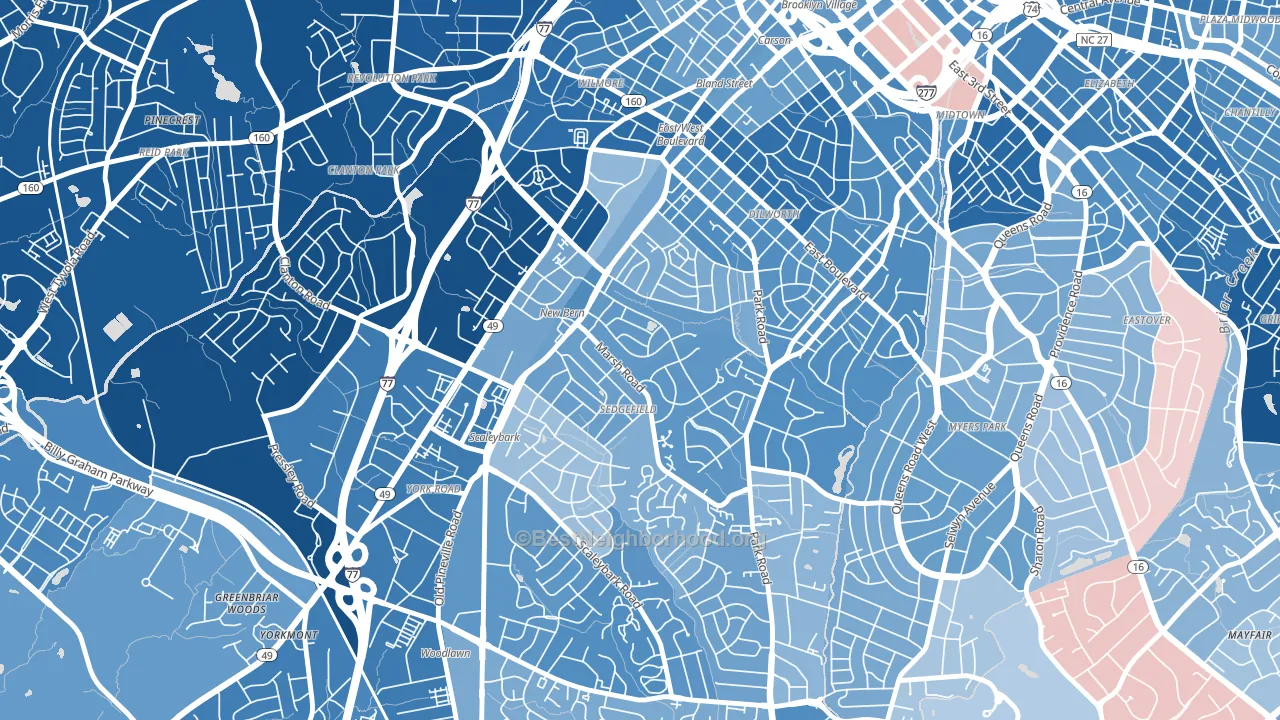
Sedgefield leans Democratic by roughly 26 points: about 63% of voters vote Democratic and 37% Republican.
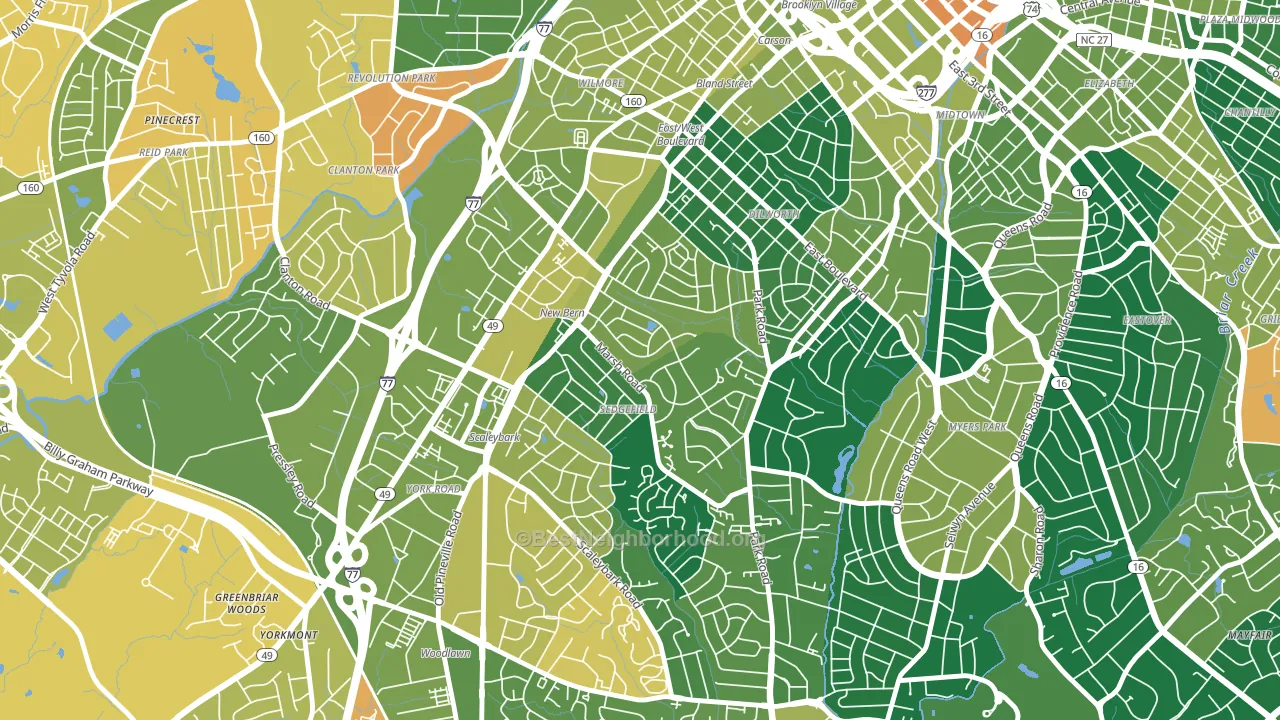
About 79% of adults in Sedgefield typically vote, above the U.S. average of about 62%. Among adults in Sedgefield, ~50% vote Democratic, ~29% Republican, and ~21% don't vote. The map below shows estimated turnout by block group.
How Sedgefield compares
Among neighborhoods within 5 miles, Sedgefield leans more Democratic than 11 of 34 neighbors.
Sedgefield runs about 30 points more Democratic than North Carolina as a whole. North Carolina leans Republican overall, while Sedgefield is one of the few Democratic-leaning pockets.
Why Sedgefield leans the way it does
This analysis examined 14,881 data points per neighborhood to find what predicts political lean and turnout. The items below are a few correlations that stood out for Sedgefield, not a ranked or complete list of what matters most.
Areas with high college attainment vote Democratic. About 81% of adults in Sedgefield hold a bachelor's degree, about 52 points above the U.S. average of 28%. Dense areas vote Democratic, and Sedgefield sits in the top fifth on density (more than 99%, above 89% of neighborhoods). Sedgefield runs against the grain of North Carolina, a Democratic-leaning pocket in a Republican-leaning state.
Population density and Democratic lean
Places with high population density tend to lean Democratic; Sedgefield, Charlotte, NC sits in the top tenth nationally on this measure.
Why turnout in Sedgefield looks the way it does
Areas with strong routine healthcare access turn out at higher rates. Sedgefield is in the top quarter nationally for routine-care measures such as insurance coverage, preventive screenings, and dental visits. The dental-visit rate here is about 73%, about 13 points above the U.S. average of 60%. High high-school completion lines up with higher turnout, and about 98% of adults in Sedgefield have completed high school, above 87% of neighborhoods. Learn more about the findings and methodology on the political spectrum map.
Nearby Neighborhoods
- Ashbrook-Clawson Village, Charlotte, NC D+27
- Dilworth, Charlotte, NC D+34
- Collingwood, Charlotte, NC D+36
- Clanton Park-Roseland, Charlotte, NC D+83
- Downtown Charlotte, Charlotte, NC D+32
- Madison Park, Charlotte, NC D+24
- Myers Park, Charlotte, NC D+9
- Third Ward, Charlotte, NC D+47
- Ashley Park, Charlotte, NC D+66
- Fourth Ward, Charlotte, NC D+44
Neighborhoods with Similar Populations
- Riverside Park, Fort Lauderdale, FL D+34
- Falcon Trace, Southchase, FL D+10
- Arctic, West Warwick, RI D+8
- North Riverside, Wichita, KS D+10
- Orem North, Orem, UT R+26
- Garden Springs, Lexington, KY D+24
- Park East, Sarasota, FL D+13
- South East Hills, Erie, PA D+16
- Farmers Market District, Dallas, TX D+51
- Kingsland, Lyndhurst, NJ R+8
Sources and methodology
Precinct-level voting records used to fit the model come from North Carolina State Board of Elections, distributed by the Voting and Election Science Team. Demographic inputs come from the U.S. Census Bureau (ACS 5-year estimates and the 2020 Decennial Census). Health and environmental inputs come from the CDC (PLACES and the Environmental Justice Index). Land cover comes from the USGS and EPA. Election-day and lead-up weather come from PRISM 4km daily grids and the NOAA Global Historical Climatology Network. Mail-voting and election-administration patterns come from the MIT Election Lab's Survey of the Performance of American Elections. Block-group crime detail comes from CrimeGrade. Internet data and modeling support provided by ISPreports.org.
Modeling and analysis by the BestNeighborhood data science team. Full methodology and findings: political spectrum map.
Methodology reviewed by the BestNeighborhood data team. Last updated May 2026.