Avalon Highlands is a Democratic stronghold. About 92% of voters here vote Democratic and 8% Republican.
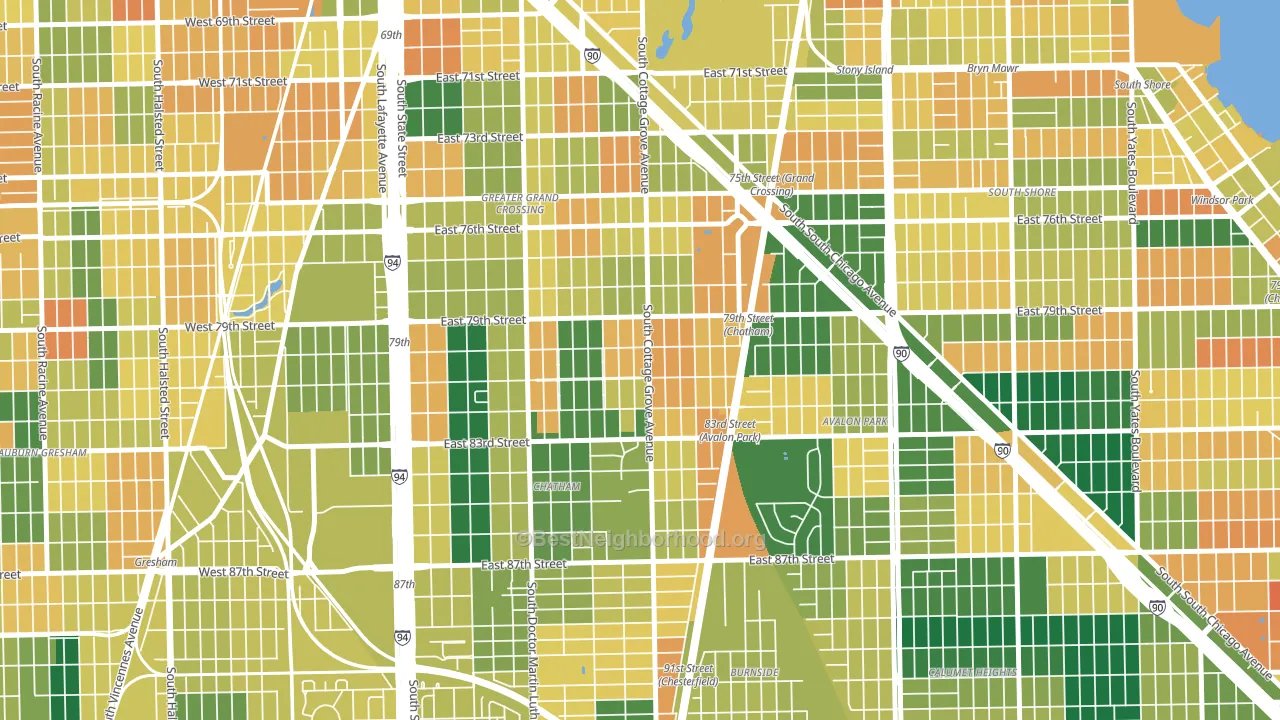
About 54% of adults in Avalon Highlands typically vote, below the U.S. average of about 62%. Among adults in Avalon Highlands, ~50% vote Democratic, ~4% Republican, and ~46% don't vote. The map below shows estimated turnout by block group.
How Avalon Highlands compares
Among neighborhoods within 5 miles, Avalon Highlands leans more Democratic than 28 of 35 neighbors.
Avalon Highlands runs about 73 points more Democratic than Illinois as a whole.
Why Avalon Highlands leans the way it does
This analysis examined 14,881 data points per neighborhood to find what predicts political lean and turnout. The items below are a few correlations that stood out for Avalon Highlands, not a ranked or complete list of what matters most.
Dense areas vote Democratic. More than 99% of residents in Avalon Highlands live in densely developed areas, about 64 points above the U.S. average of 36%. A high never-married share predicts Democratic voting, and about 58% of adults in Avalon Highlands have never been married, above 92% of neighborhoods.
Preventive-care access and voter turnout
Places with limited routine preventive-care access tend to turn out at a lower rate; Avalon Highlands, Chicago, IL sits in the bottom quarter nationally on this measure. Dental visits do not drive turnout; the rate reflects income, insurance, and healthcare access, which line up with who votes.
Why turnout in Avalon Highlands looks the way it does
Areas with high food insecurity turn out at lower rates. About 41% of adults in Avalon Highlands report food insecurity, about 25 points above the U.S. average of 16%. Renters vote less often than owners, and about 71% of households in Avalon Highlands rent, about 46 points above the U.S. average of 25%. High-crime urban areas turn out at lower rates, and Avalon Highlands sits in the top 15% on a violent-crime measure. Learn more about the findings and methodology on the political spectrum map.
Nearby Neighborhoods
- Italian Bowery, Chicago, IL D+82
- Chatham, Chicago, IL D+85
- Avalon Park, Chicago, IL D+86
- Essex, Chicago, IL D+82
- Grand Crossing, Chicago, IL D+82
- Auburn Park, Chicago, IL D+82
- South Shore, Chicago, IL D+83
- Calumet Heights, Chicago, IL D+85
- Chester Highlands, Chicago, IL D+83
- Woodlawn, Chicago, IL D+82
Neighborhoods with Similar Populations
- Mount Washington, Pittsburgh, PA D+40
- Bagley Downs, Vancouver, WA D+20
- Crescent Hill, Louisville, KY D+46
- South Beaverton, Beaverton, OR D+41
- Old Seminol Heights, Tampa, FL D+36
- Elvira, Summit, AZ D+40
- Los Angeles Heights-Keystone, San Antonio, TX D+36
- Harvest Bend, Houston, TX D+5
- Cedar Hills, Cedar Rapids, IA D+20
- Twain, Iowa City, IA D+44
Sources and methodology
Precinct-level voting records used to fit the model come from Illinois State Board of Elections, distributed by the Voting and Election Science Team. Demographic inputs come from the U.S. Census Bureau (ACS 5-year estimates and the 2020 Decennial Census). Health and environmental inputs come from the CDC (PLACES and the Environmental Justice Index). Land cover comes from the USGS and EPA. Election-day and lead-up weather come from PRISM 4km daily grids and the NOAA Global Historical Climatology Network. Mail-voting and election-administration patterns come from the MIT Election Lab's Survey of the Performance of American Elections. Block-group crime detail comes from CrimeGrade. Internet data and modeling support provided by ISPreports.org.
Modeling and analysis by the BestNeighborhood data science team. Full methodology and findings: political spectrum map.
Methodology reviewed by the BestNeighborhood data team. Last updated May 2026.