Mission Bay leans Democratic by roughly 20 points: about 60% of voters vote Democratic and 40% Republican.
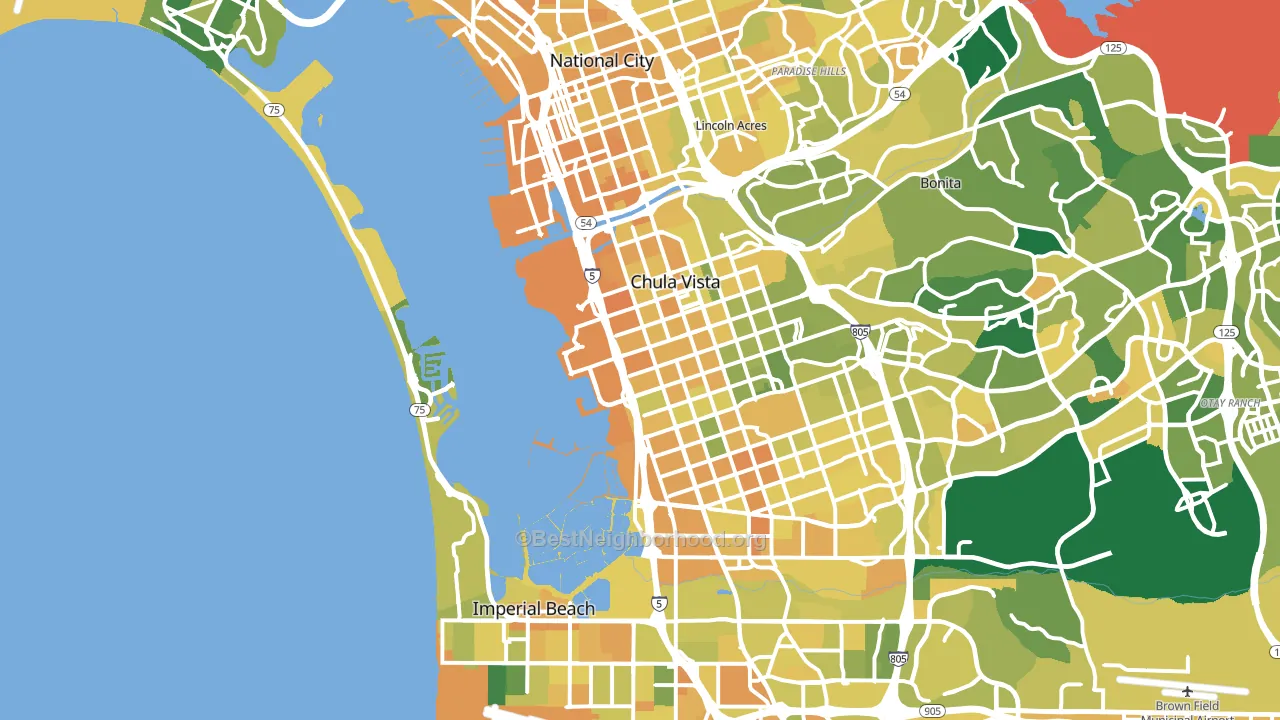
About 59% of adults in Mission Bay typically vote, near the U.S. average of about 62%. Among adults in Mission Bay, ~36% vote Democratic, ~24% Republican, and ~40% don't vote. The map below shows estimated turnout by block group.
How Mission Bay compares
Among neighborhoods within 5 miles, Mission Bay leans more Democratic than 10 of 16 neighbors.
Politically, Mission Bay sits close to the rest of California.
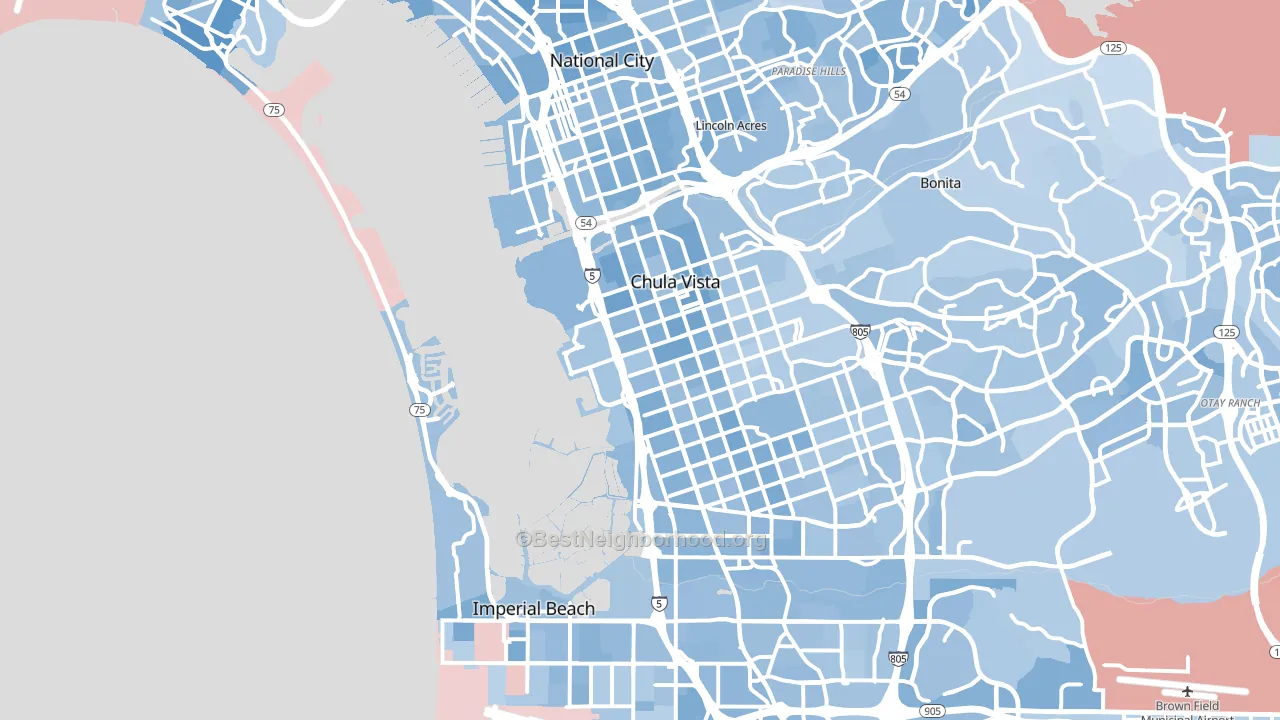
Politics vary noticeably by block within Mission Bay. The west side is the most Democratic-leaning (D+35) and the southeast side is the least Democratic-leaning (D+14), a spread of about 21 points.
Why Mission Bay leans the way it does
Density, race composition, education, and family structure all sit close to their national averages in Mission Bay. The lean here lands roughly where demographic data alone would predict.
Population density and Democratic lean
Places with high population density tend to lean Democratic; Mission Bay, San Diego, CA sits in the top quarter nationally on this measure.
Why turnout in Mission Bay looks the way it does
Crowded housing lines up with lower turnout. About 9% of homes in Mission Bay have more than one occupant per room, above 90% of neighborhoods. Learn more about the findings and methodology on the political spectrum map.
Nearby Neighborhoods
- Downtown Chula Vista, Chula Vista, CA D+26
- Boal, Chula Vista, CA D+23
- Terra Nova, Chula Vista, CA D+14
- Palm City, San Diego, CA D+20
- Lynwood Hills, Chula Vista, CA D+16
- Egger Highlands, San Diego, CA D+16
- Paradise Hills, San Diego, CA D+21
- Sunbow, Chula Vista, CA D+18
- Otay Mesa West, San Diego, CA D+20
- Nestor, San Diego, CA D+19
Neighborhoods with Similar Populations
- Montello, Brockton, MA D+44
- Valley High-North Laguna, Sacramento, CA D+33
- South Ozone Park, Queens, NY D+31
- Northeast Colorado Springs, Colorado Springs, CO Even
- Outer Sunset, San Francisco, CA D+49
- Downtown Memphis, Memphis, TN D+69
- Country Club, Bronx, NY D+66
- Sunnyvale West, Sunnyvale, CA D+37
- Makakilo-Kapolei-Honokai Hale, Kapolei, HI D+8
- Allapattah, Miami, FL R+6
Sources and methodology
Precinct-level voting records used to fit the model come from California Secretary of State, Elections, distributed by the Voting and Election Science Team. Demographic inputs come from the U.S. Census Bureau (ACS 5-year estimates and the 2020 Decennial Census). Health and environmental inputs come from the CDC (PLACES and the Environmental Justice Index). Land cover comes from the USGS and EPA. Election-day and lead-up weather come from PRISM 4km daily grids and the NOAA Global Historical Climatology Network. Mail-voting and election-administration patterns come from the MIT Election Lab's Survey of the Performance of American Elections. Block-group crime detail comes from CrimeGrade. Internet data and modeling support provided by ISPreports.org.
Modeling and analysis by the BestNeighborhood data science team. Full methodology and findings: political spectrum map.
Methodology reviewed by the BestNeighborhood data team. Last updated May 2026.