Neshoba County leans heavily Republican by roughly 32 points: about 34% of voters vote Democratic and 66% Republican.
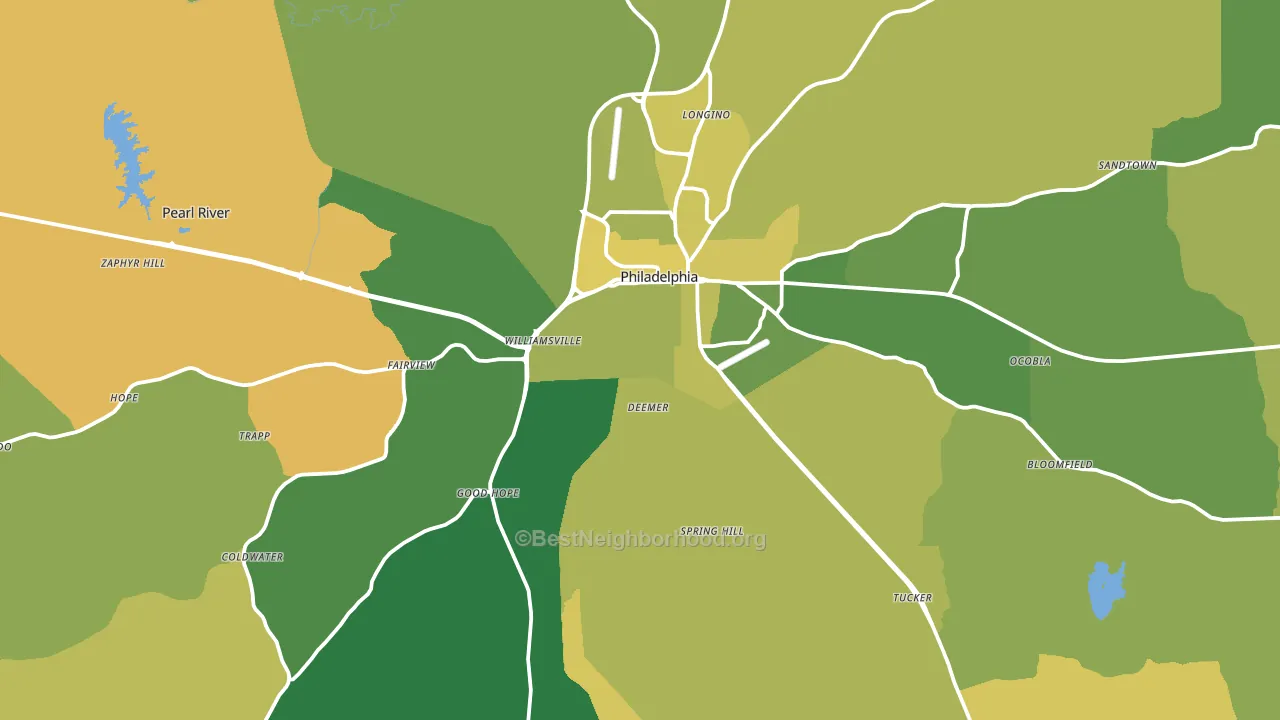
About 66% of adults in Neshoba County typically vote, near the U.S. average of about 62%. Among adults in Neshoba County, ~22% vote Democratic, ~44% Republican, and ~34% don't vote. The map below shows estimated turnout by block group.
How Neshoba County compares
Among counties within 50 miles, Neshoba County leans more Republican than 7 of 9 neighbors.
Neshoba County runs about 9 points more Republican than Mississippi as a whole.
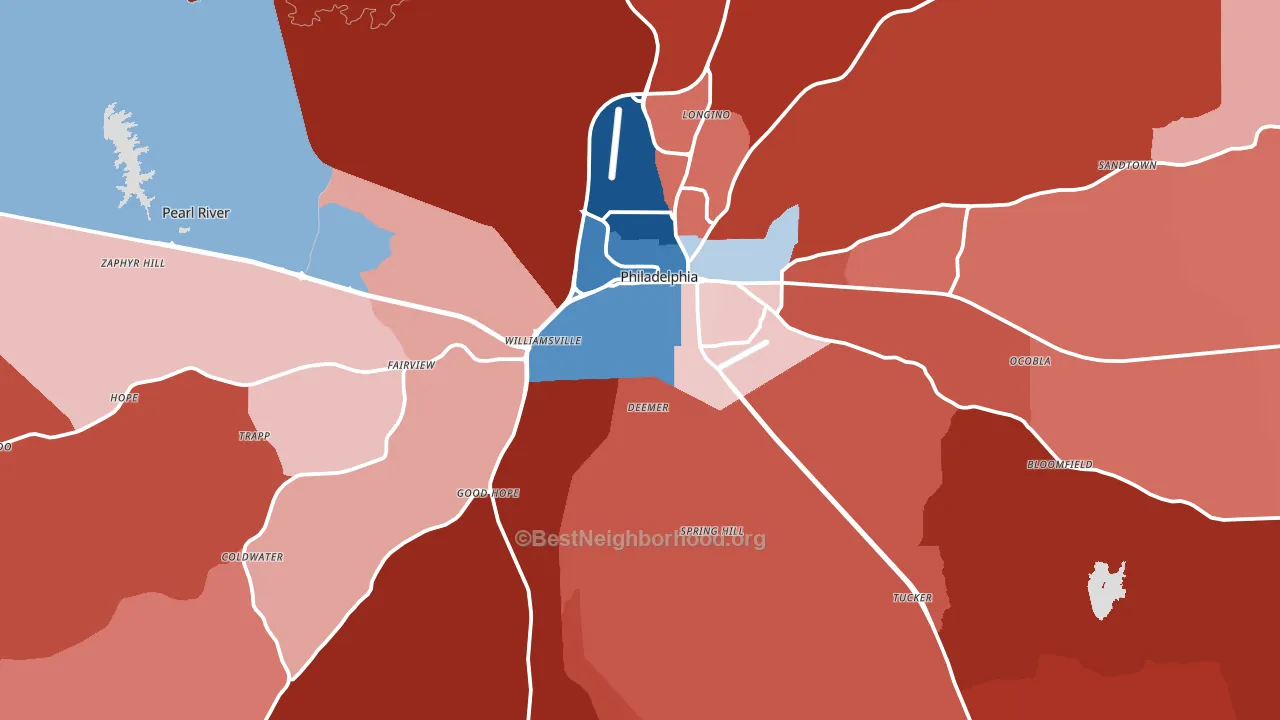
Politics vary noticeably by city within Neshoba County. The north side runs the most Democratic (D+6) and the southeast side runs the most Republican (R+83), a spread of about 88 points.
Why Neshoba County leans the way it does
This analysis examined 14,881 data points per county to find what predicts political lean and turnout. The items below are a few correlations that stood out for Neshoba County, not a ranked or complete list of what matters most.
Areas with many family households vote Republican. About 73% of households in Neshoba County are family households, about 6 points above the U.S. average of 67%.
Park access and Republican lean
Places with low park coverage tend to lean Republican; Neshoba County, MS sits in the bottom tenth nationally on this measure. Park access does not change how people vote; it tends to track denser, higher-income areas.
Why turnout in Neshoba County looks the way it does
Turnout in Neshoba County sits close to the national pattern. Routine healthcare access, homeownership, education, and food security all land near their national averages here. Learn more about the findings and methodology on the political spectrum map.
Nearby Counties
- Leake County, MS R+12
- Winston County, MS R+10
- Newton County, MS R+34
- Kemper County, MS D+23
- Scott County, MS R+18
- Attala County, MS R+13
- Lauderdale County, MS R+5
- Choctaw County, MS R+37
- Noxubee County, MS D+49
- Oktibbeha County, MS D+3
Counties with Similar Populations
- Hancock County, WV R+42
- Morgan County, CO R+37
- Mason County, MI R+20
- Carroll County, VA R+63
- Ripley County, IN R+59
- Marion County, SC D+17
- Gallia County, OH R+57
- Fayette County, OH R+55
- Ellis County, KS R+38
- Van Wert County, OH R+56
Sources and methodology
Precinct-level voting records used to fit the model come from Mississippi Secretary of State, Elections, distributed by the Voting and Election Science Team. Demographic inputs come from the U.S. Census Bureau (ACS 5-year estimates and the 2020 Decennial Census). Health and environmental inputs come from the CDC (PLACES and the Environmental Justice Index). Land cover comes from the USGS and EPA. Election-day and lead-up weather come from PRISM 4km daily grids and the NOAA Global Historical Climatology Network. Mail-voting and election-administration patterns come from the MIT Election Lab's Survey of the Performance of American Elections. Block-group crime detail comes from CrimeGrade. Internet data and modeling support provided by ISPreports.org.
Modeling and analysis by the BestNeighborhood data science team. Full methodology and findings: political spectrum map.
Methodology reviewed by the BestNeighborhood data team. Last updated May 2026.