Winston County leans slightly Republican by roughly 10 points: about 45% of voters vote Democratic and 55% Republican.
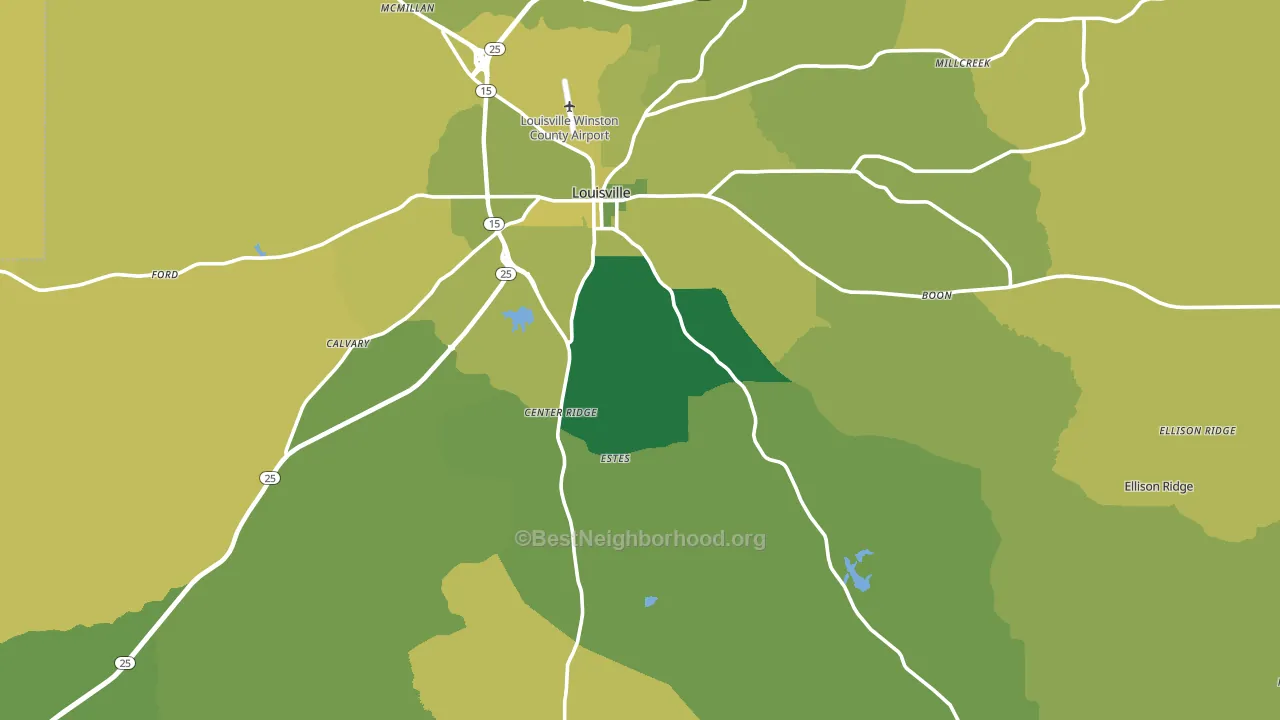
About 69% of adults in Winston County typically vote, above the U.S. average of about 62%. Among adults in Winston County, ~31% vote Democratic, ~38% Republican, and ~31% don't vote. The map below shows estimated turnout by block group.
How Winston County compares
Among counties within 50 miles, Winston County leans more Republican than 6 of 12 neighbors.
Winston County runs about 13 points more Democratic than Mississippi as a whole.
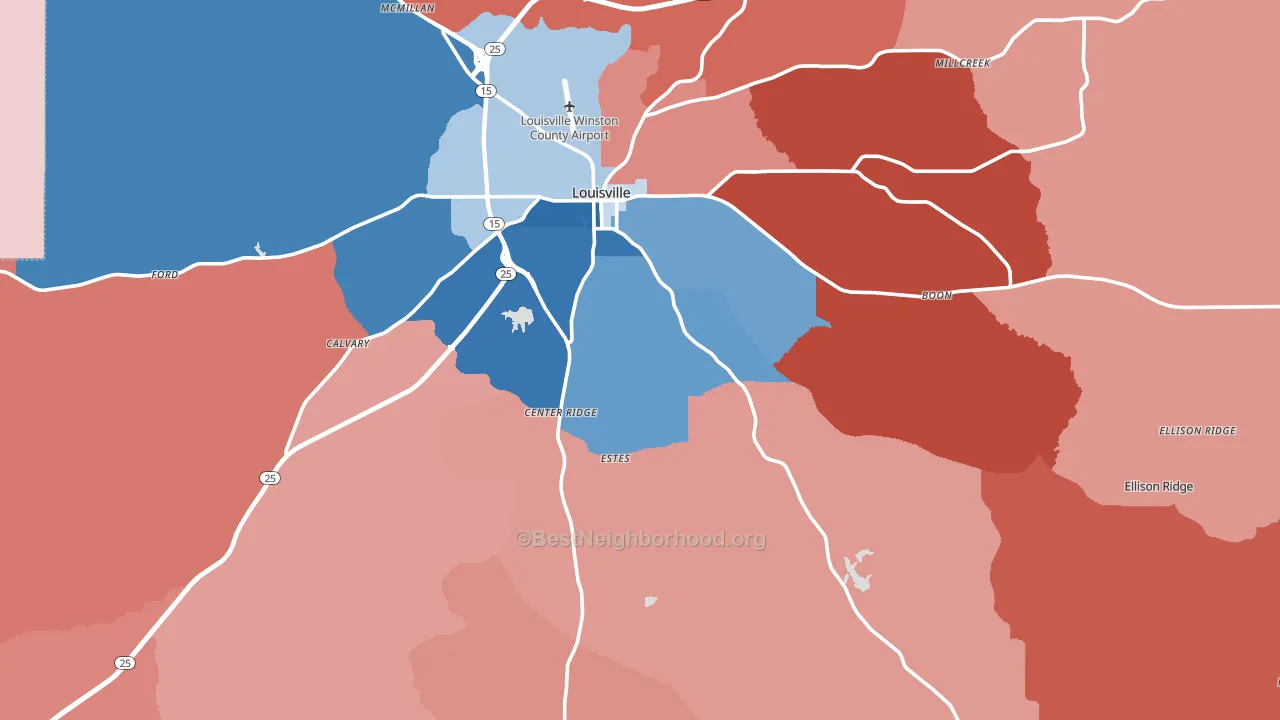
Politics vary noticeably by city within Winston County. The northwest side runs the most Democratic (D+52) and the southeast side runs the most Republican (R+53), a spread of about 106 points.
Why Winston County leans the way it does
This analysis examined 14,881 data points per county to find what predicts political lean and turnout. The items below are a few correlations that stood out for Winston County, not a ranked or complete list of what matters most.
Car-dependent areas vote Republican. About 85% of residents in Winston County drive to work alone, about 11 points above the U.S. average of 74%.
Population density and Republican lean
Places with low population density tend to lean Republican; Winston County, MS sits below the national average on this measure.
Why turnout in Winston County looks the way it does
Turnout in Winston County sits close to the national pattern. Learn more about the findings and methodology on the political spectrum map.
Nearby Counties
- Choctaw County, MS R+37
- Neshoba County, MS R+31
- Oktibbeha County, MS D+3
- Noxubee County, MS D+49
- Kemper County, MS D+23
- Attala County, MS R+13
- Webster County, MS R+60
- Leake County, MS R+12
- Clay County, MS D+18
- Newton County, MS R+34
Counties with Similar Populations
- Eastland County, TX R+67
- Dickinson County, IA R+34
- Hughes County, SD R+34
- Burleson County, TX R+53
- San Juan County, WA D+50
- Avery County, NC R+52
- Hancock County, IL R+45
- King William County, VA R+38
- Seward County, NE R+52
- Patrick County, VA R+58
Sources and methodology
Precinct-level voting records used to fit the model come from Mississippi Secretary of State, Elections, distributed by the Voting and Election Science Team. Demographic inputs come from the U.S. Census Bureau (ACS 5-year estimates and the 2020 Decennial Census). Health and environmental inputs come from the CDC (PLACES and the Environmental Justice Index). Land cover comes from the USGS and EPA. Election-day and lead-up weather come from PRISM 4km daily grids and the NOAA Global Historical Climatology Network. Mail-voting and election-administration patterns come from the MIT Election Lab's Survey of the Performance of American Elections. Block-group crime detail comes from CrimeGrade. Internet data and modeling support provided by ISPreports.org.
Modeling and analysis by the BestNeighborhood data science team. Full methodology and findings: political spectrum map.
Methodology reviewed by the BestNeighborhood data team. Last updated May 2026.