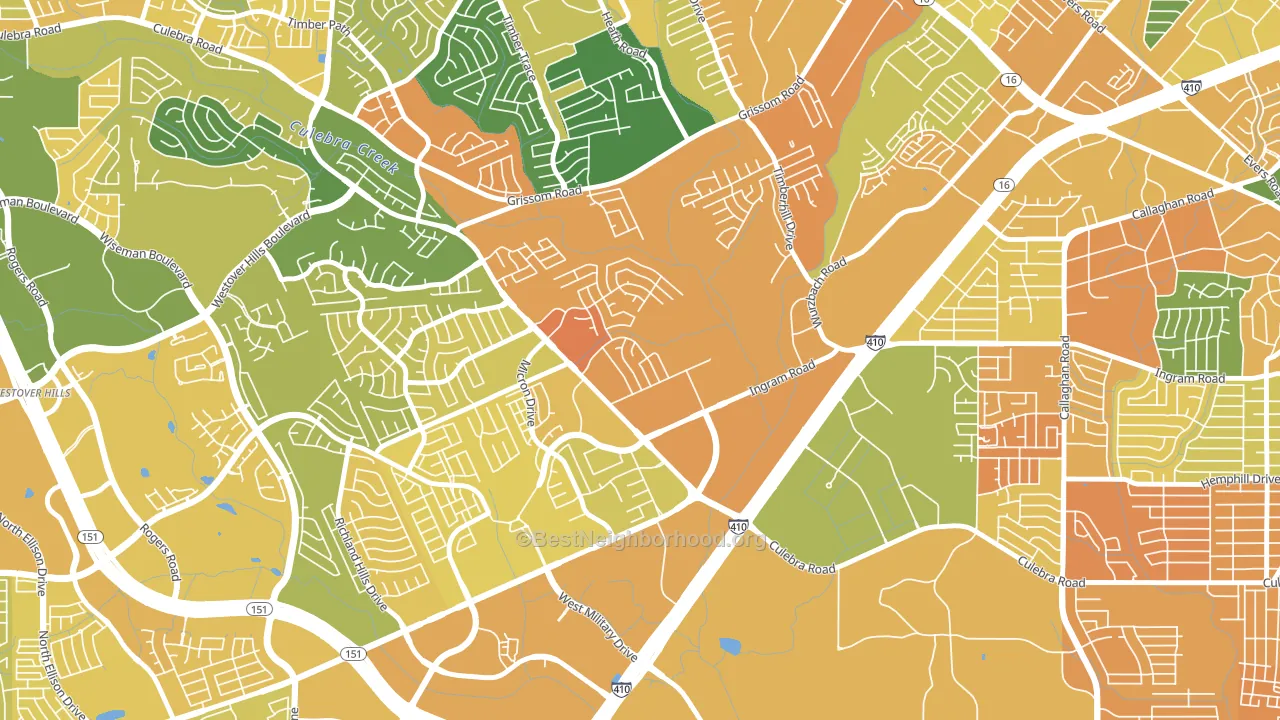
Pipers Meadow leans Democratic by roughly 22 points: about 61% of voters vote Democratic and 39% Republican.
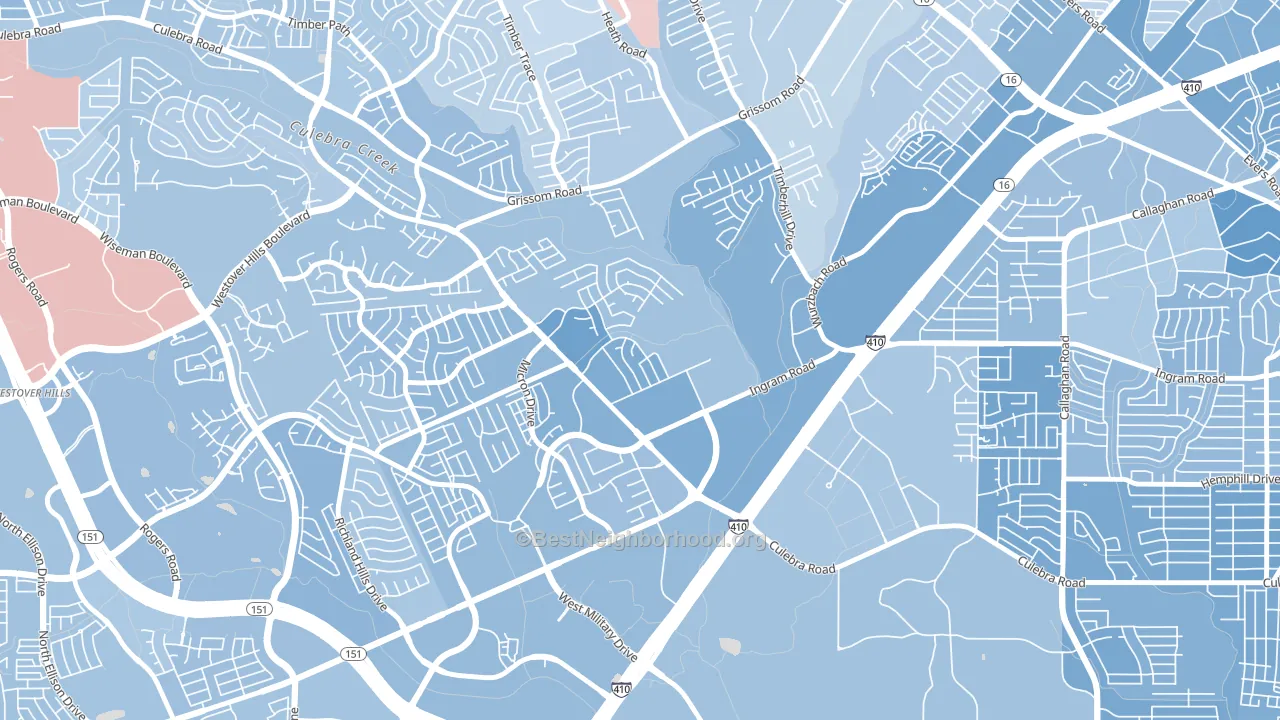
About 32% of adults in Pipers Meadow typically vote, below the U.S. average of about 62%. Among adults in Pipers Meadow, ~20% vote Democratic, ~12% Republican, and ~68% don't vote. The map below shows estimated turnout by block group.
How Pipers Meadow compares
Among neighborhoods within 5 miles, Pipers Meadow leans more Democratic than 9 of 26 neighbors.
Pipers Meadow runs about 35 points more Democratic than Texas as a whole. Texas leans Republican overall, while Pipers Meadow is one of the few Democratic-leaning pockets.
Why Pipers Meadow leans the way it does
This analysis examined 14,881 data points per neighborhood to find what predicts political lean and turnout. The items below are a few correlations that stood out for Pipers Meadow, not a ranked or complete list of what matters most.
Pipers Meadow votes against the grain of Texas. Texas leans Republican overall, while Pipers Meadow runs about 35 points more Democratic. A high never-married share predicts Democratic voting, and about 47% of adults in Pipers Meadow have never been married, above 77% of neighborhoods.
Population density and Democratic lean
Places with high population density tend to lean Democratic; Pipers Meadow, San Antonio, TX sits above the national average on this measure.
Why turnout in Pipers Meadow looks the way it does
Areas with limited routine healthcare access turn out at lower rates. Pipers Meadow is in the bottom quarter nationally for routine-care measures such as insurance coverage, preventive screenings, and dental visits. The uninsured rate here is about 26%, about 8 points above the Texas average of 19%. Renters vote less often than owners, and about 74% of households in Pipers Meadow rent, compared to around 40% in nearby neighborhoods. Low high-school completion lines up with lower turnout, and about 83% of adults in Pipers Meadow have completed high school, below 80% of neighborhoods. Learn more about the findings and methodology on the political spectrum map.
Nearby Neighborhoods
- Crown Meadows, San Antonio, TX D+22
- Timber Ridge, San Antonio, TX D+15
- Thunderbird Hills, San Antonio, TX D+23
- San Antonio Creekside, San Antonio, TX D+11
- Great Northwest, San Antonio, TX D+10
- Culebra Park, San Antonio, TX D+27
- Meadow Village, San Antonio, TX D+24
- United Westwood, San Antonio, TX D+28
- Ingram Hills, San Antonio, TX D+24
- Heritage, San Antonio, TX D+20
Neighborhoods with Similar Populations
- Balboa, Spokane, WA D+4
- Cedar Park, Seattle, WA D+67
- Rabbit Creek, Anchorage, AK D+13
- Sloan Lake, Denver, CO D+62
- Matthews Beach, Seattle, WA D+73
- Downtown Turlock, Turlock, CA Even
- Trestle Glen, Oakland, CA D+80
- Westside Lansing, Lansing, MI D+54
- Greenway, Beaverton, OR D+43
- Jacksonville Farms-Terrace, Jacksonville, FL D+16
Sources and methodology
Precinct-level voting records used to fit the model come from Texas Secretary of State, Elections Division, distributed by the Voting and Election Science Team. Demographic inputs come from the U.S. Census Bureau (ACS 5-year estimates and the 2020 Decennial Census). Health and environmental inputs come from the CDC (PLACES and the Environmental Justice Index). Land cover comes from the USGS and EPA. Election-day and lead-up weather come from PRISM 4km daily grids and the NOAA Global Historical Climatology Network. Mail-voting and election-administration patterns come from the MIT Election Lab's Survey of the Performance of American Elections. Block-group crime detail comes from CrimeGrade. Internet data and modeling support provided by ISPreports.org.
Modeling and analysis by the BestNeighborhood data science team. Full methodology and findings: political spectrum map.
Methodology reviewed by the BestNeighborhood data team. Last updated May 2026.