Oakhurst is a Democratic stronghold. About 88% of voters here vote Democratic and 12% Republican.
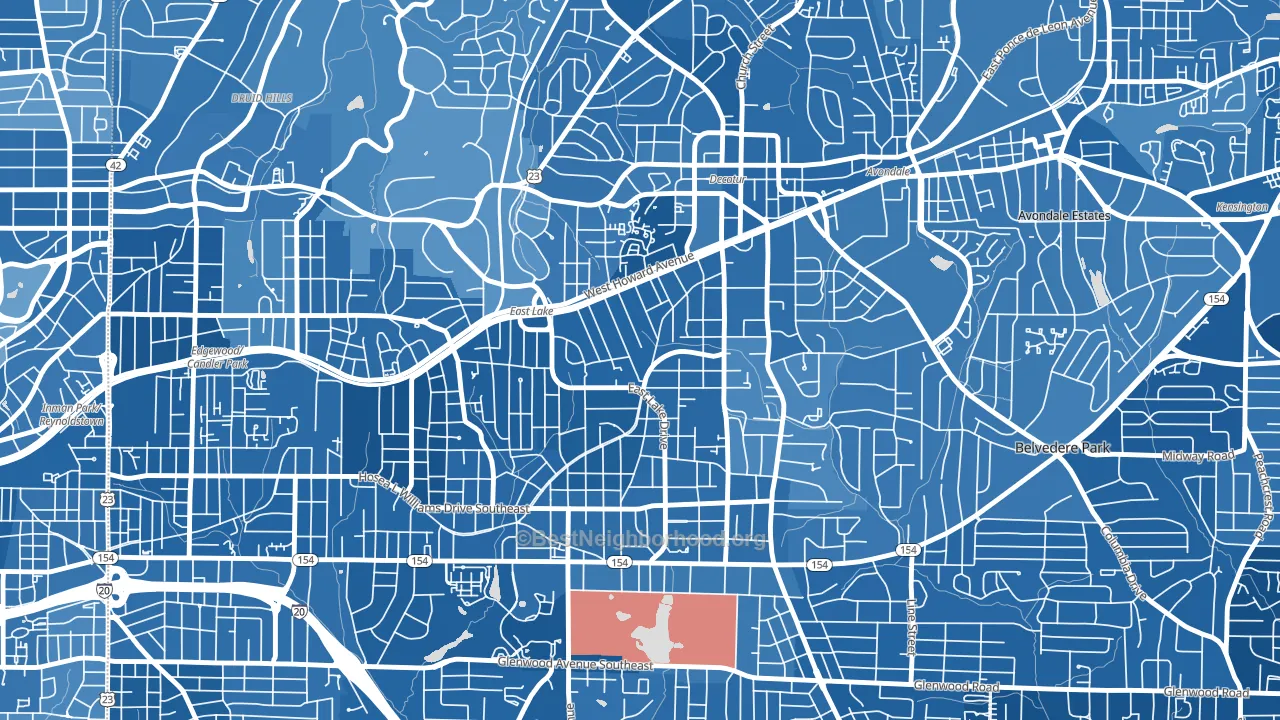
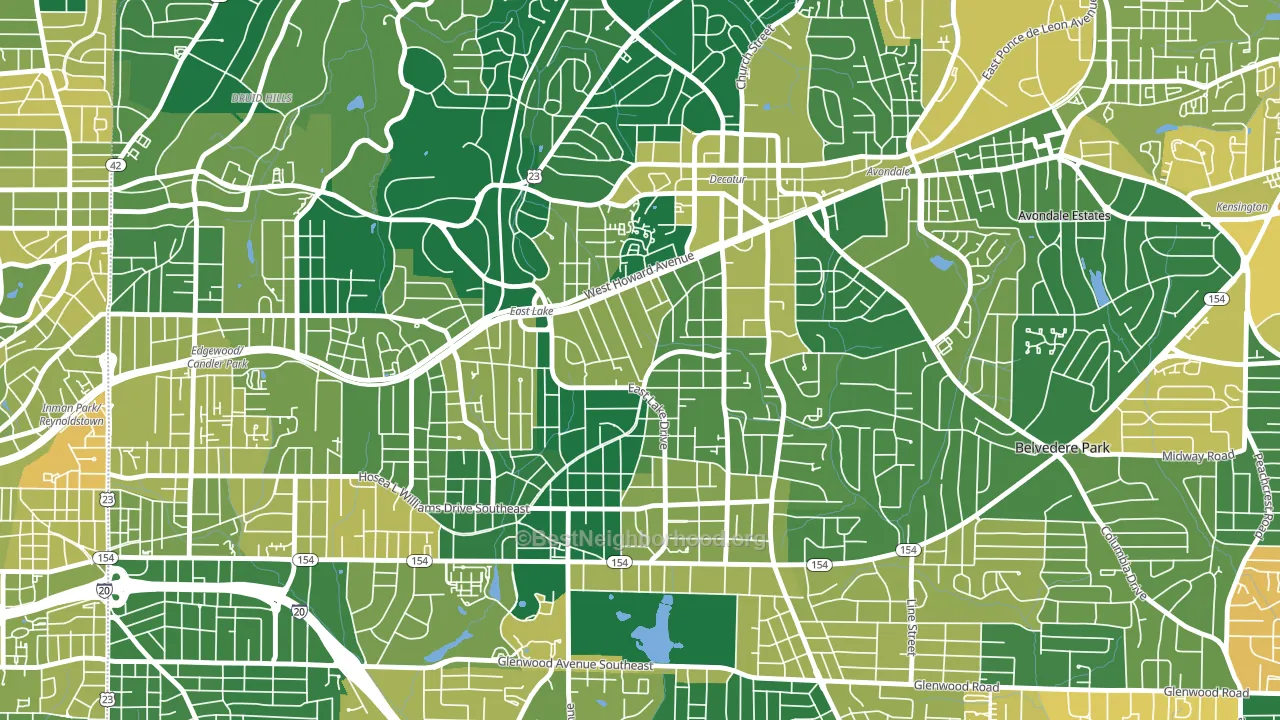
About 90% of adults in Oakhurst typically vote, above the U.S. average of about 62%. Among adults in Oakhurst, ~79% vote Democratic, ~11% Republican, and ~10% don't vote. The map below shows estimated turnout by block group.
How Oakhurst compares
Among neighborhoods within 5 miles, Oakhurst is the most Democratic-leaning.
Oakhurst runs about 79 points more Democratic than Georgia as a whole. Georgia is roughly evenly split, and Oakhurst sits clearly on the Democratic side.
Politics vary noticeably by block within Oakhurst. The southwest side is the most Democratic-leaning (D+79) and the northwest side is the least Democratic-leaning (D+64), a spread of about 15 points.
Why Oakhurst leans the way it does
This analysis examined 14,881 data points per neighborhood to find what predicts political lean and turnout. The items below are a few correlations that stood out for Oakhurst, not a ranked or complete list of what matters most.
Areas with high college attainment vote Democratic. About 77% of adults in Oakhurst hold a bachelor's degree, about 49 points above the U.S. average of 28%. Oakhurst runs against the grain of Georgia, a Democratic-leaning outlier in a roughly evenly split state.
Walkability and Democratic lean
Places with a highly walkable street grid tend to lean Democratic; Oakhurst, Decatur, GA sits in the top quarter nationally on this measure. A walkable street grid does not change how people vote; it mostly reflects how urban a place is.
Why turnout in Oakhurst looks the way it does
Areas with strong routine healthcare access turn out at higher rates. Oakhurst is in the top quarter nationally for routine-care measures such as insurance coverage, preventive screenings, and dental visits. The dental-visit rate here is about 72%, about 12 points above the U.S. average of 60%. Learn more about the findings and methodology on the political spectrum map.
Nearby Neighborhoods
- Winnona Park, Decatur, GA D+69
- Edgewood-Kirkwood, Atlanta, GA D+75
- Candler Park, Atlanta, GA D+64
- Atlanta-Inman Park, Atlanta, GA D+56
- Poncey-Highland, Atlanta, GA D+67
- Ormewood Park-East Atlanta, Atlanta, GA D+67
- Virginia-Highland, Atlanta, GA D+53
- Cabbage Town, Atlanta, GA D+69
- Old Fourth Ward, Atlanta, GA D+59
- Sweet Auburn, Atlanta, GA D+72
Neighborhoods with Similar Populations
- Downtown, Kent, WA D+36
- Gresham-Southwest, Gresham, OR D+10
- East Phillips, Minneapolis, MN D+63
- Victoria Gardens, Rancho Cucamonga, CA D+11
- Old Town, Eureka, CA D+38
- Dexter Falls, Columbus, OH D+21
- South Hagginwood, Sacramento, CA D+27
- Seven Bar Ranch, Albuquerque, NM D+21
- Jacksonville Heights West, Jacksonville, FL D+27
- Apollo Arapaho and Camelot, Garland, TX D+16
Sources and methodology
Precinct-level voting records used to fit the model come from Georgia Elections Division, distributed by the Voting and Election Science Team. Demographic inputs come from the U.S. Census Bureau (ACS 5-year estimates and the 2020 Decennial Census). Health and environmental inputs come from the CDC (PLACES and the Environmental Justice Index). Land cover comes from the USGS and EPA. Election-day and lead-up weather come from PRISM 4km daily grids and the NOAA Global Historical Climatology Network. Mail-voting and election-administration patterns come from the MIT Election Lab's Survey of the Performance of American Elections. Block-group crime detail comes from CrimeGrade. Internet data and modeling support provided by ISPreports.org.
Modeling and analysis by the BestNeighborhood data science team. Full methodology and findings: political spectrum map.
Methodology reviewed by the BestNeighborhood data team. Last updated May 2026.