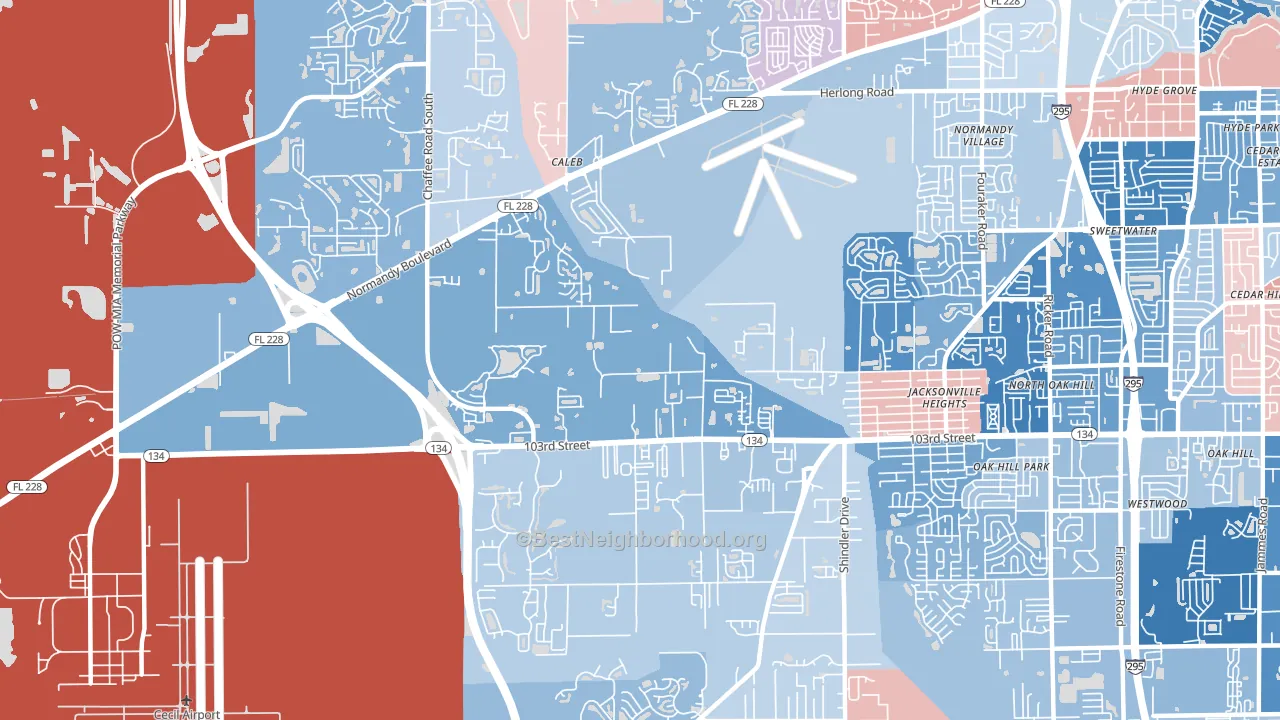
Jacksonville Heights West leans Democratic by roughly 26 points: about 63% of voters vote Democratic and 37% Republican.
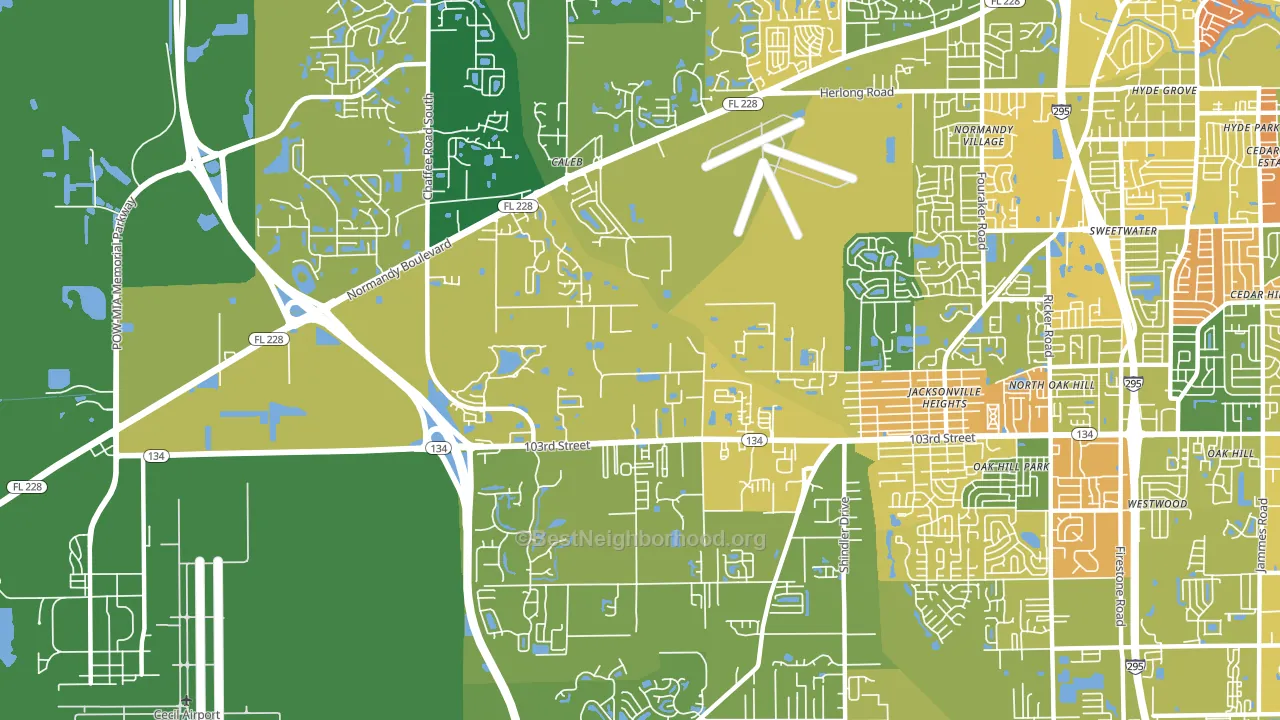
About 56% of adults in Jacksonville Heights West typically vote, below the U.S. average of about 62%. Among adults in Jacksonville Heights West, ~35% vote Democratic, ~21% Republican, and ~44% don't vote. The map below shows estimated turnout by block group.
How Jacksonville Heights West compares
Among neighborhoods within 5 miles, Jacksonville Heights West leans more Democratic than 13 of 16 neighbors.
Jacksonville Heights West runs about 40 points more Democratic than Florida as a whole. Florida leans Republican overall, while Jacksonville Heights West is one of the few Democratic-leaning pockets.
Why Jacksonville Heights West leans the way it does
This analysis examined 14,881 data points per neighborhood to find what predicts political lean and turnout. The items below are a few correlations that stood out for Jacksonville Heights West, not a ranked or complete list of what matters most.
Rural, majority-Black areas of the Southern Black Belt vote Democratic, against the usual rural pattern. About 46% of residents in Jacksonville Heights West are Black or African American, about 33 points above the Florida average of 13%. Jacksonville Heights West runs against the grain of Florida, a Democratic-leaning pocket in a Republican-leaning state.
Walkability and Republican lean
Places with a low walkability score tend to lean Republican; Jacksonville Heights West, Jacksonville, FL sits in the bottom tenth nationally on this measure. A walkable street grid does not change how people vote; it mostly reflects how urban a place is.
Why turnout in Jacksonville Heights West looks the way it does
Areas with limited routine healthcare access turn out at lower rates. Jacksonville Heights West is in the bottom quarter nationally for routine-care measures such as insurance coverage, preventive screenings, and dental visits. Learn more about the findings and methodology on the political spectrum map.
Nearby Neighborhoods
- Jacksonville Heights South, Jacksonville, FL D+10
- Herlong, Jacksonville, FL D+22
- Jacksonville Heights, Jacksonville, FL D+30
- Normandy Estates, Jacksonville, FL Even
- Jacksonville Farms-Terrace, Jacksonville, FL D+16
- Normandy Manor, Jacksonville, FL D+3
- Crystal Springs, Jacksonville, FL R+3
- Settlers Landing, Jacksonville, FL R+7
- McGirts Creek, Jacksonville, FL D+19
- Chimney Lakes, Jacksonville, FL D+5
Neighborhoods with Similar Populations
- Seven Bar Ranch, Albuquerque, NM D+21
- South Hagginwood, Sacramento, CA D+27
- Dexter Falls, Columbus, OH D+21
- Apollo Arapaho and Camelot, Garland, TX D+16
- Wesconnett, Jacksonville, FL D+10
- Old Town, Eureka, CA D+38
- Victoria Gardens, Rancho Cucamonga, CA D+11
- La Colonia, Oxnard, CA D+39
- Gresham-Southwest, Gresham, OR D+10
- Abilene Heights Area, Abilene, TX R+24
Sources and methodology
Precinct-level voting records used to fit the model come from Florida Division of Elections, distributed by the Voting and Election Science Team. Demographic inputs come from the U.S. Census Bureau (ACS 5-year estimates and the 2020 Decennial Census). Health and environmental inputs come from the CDC (PLACES and the Environmental Justice Index). Land cover comes from the USGS and EPA. Election-day and lead-up weather come from PRISM 4km daily grids and the NOAA Global Historical Climatology Network. Mail-voting and election-administration patterns come from the MIT Election Lab's Survey of the Performance of American Elections. Block-group crime detail comes from CrimeGrade. Internet data and modeling support provided by ISPreports.org.
Modeling and analysis by the BestNeighborhood data science team. Full methodology and findings: political spectrum map.
Methodology reviewed by the BestNeighborhood data team. Last updated May 2026.