Old Town leans heavily Democratic by roughly 38 points: about 69% of voters vote Democratic and 31% Republican.
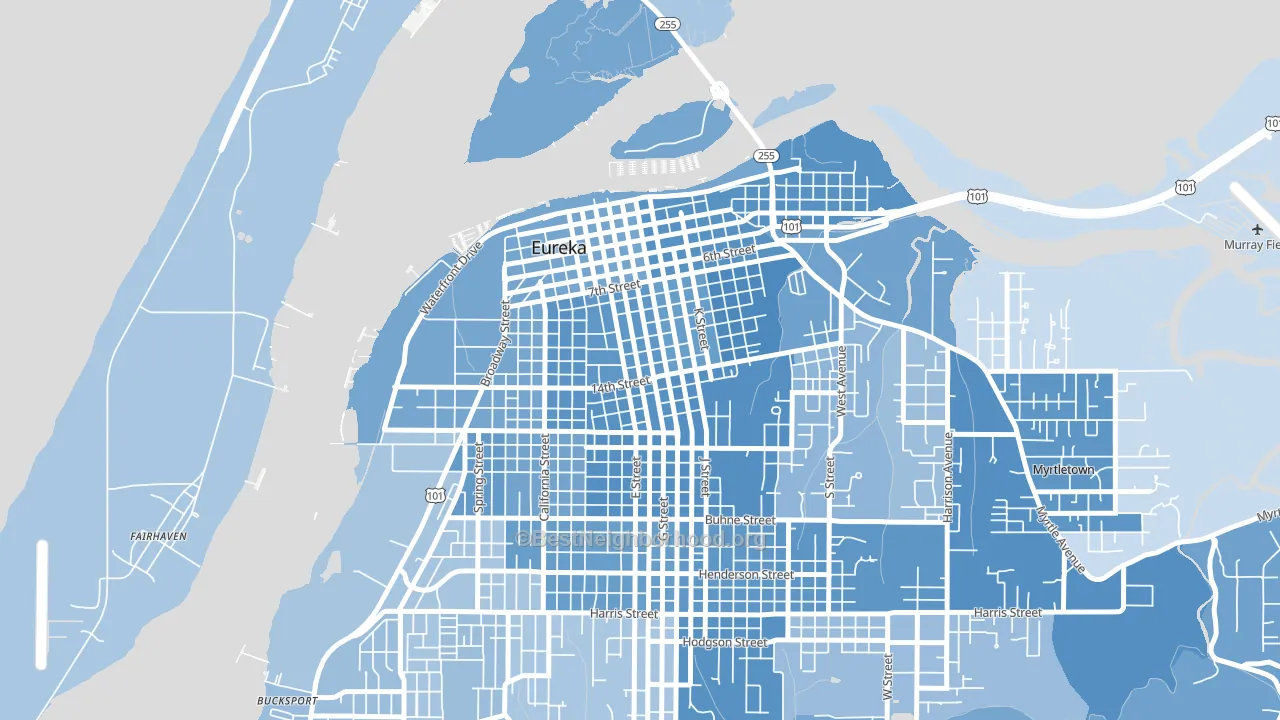
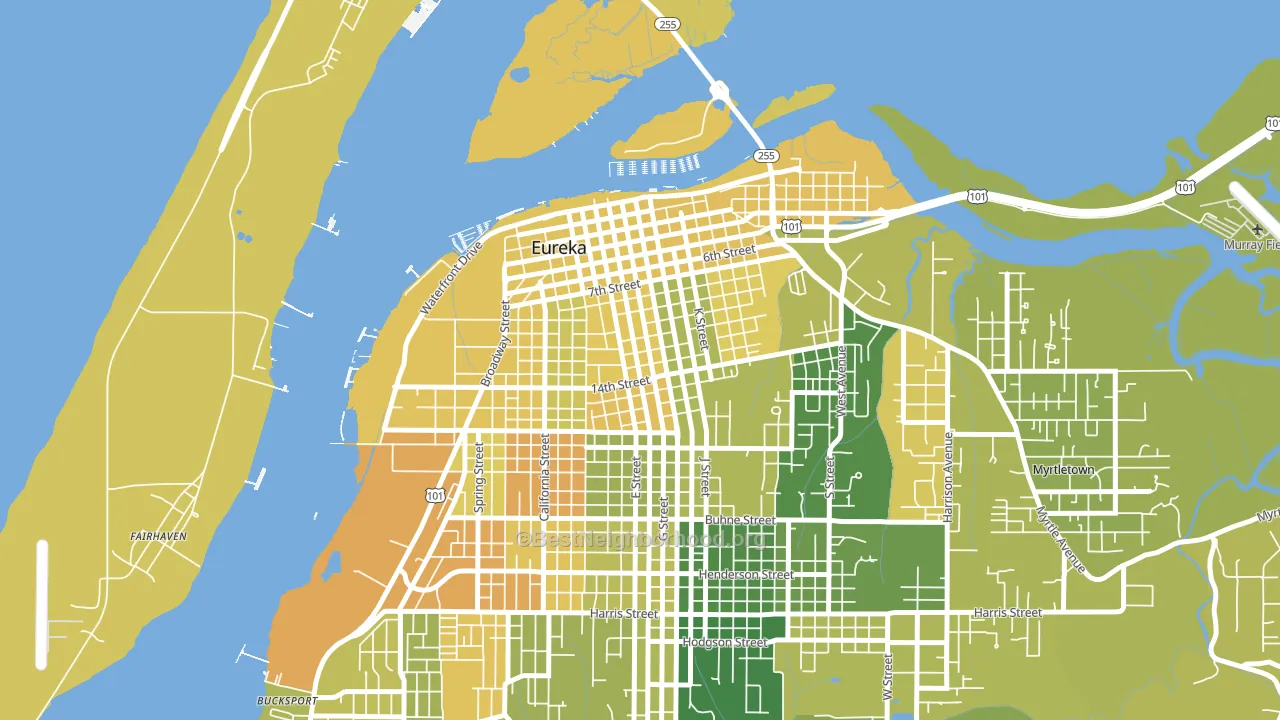
About 53% of adults in Old Town typically vote, below the U.S. average of about 62%. Among adults in Old Town, ~37% vote Democratic, ~16% Republican, and ~47% don't vote. The map below shows estimated turnout by block group.
How Old Town compares
Among neighborhoods within 5 miles, Old Town is the most Democratic-leaning.
Old Town runs about 18 points more Democratic than California as a whole.
Politics vary noticeably by block within Old Town. The east side is the most Democratic-leaning (D+45) and the south side is the least Democratic-leaning (D+30), a spread of about 15 points.
Why Old Town leans the way it does
This analysis examined 14,881 data points per neighborhood to find what predicts political lean and turnout. The items below are a few correlations that stood out for Old Town, not a ranked or complete list of what matters most.
Areas with many never-married adults vote Democratic. About 50% of adults in Old Town have never been married, modestly above similar-sized neighborhoods (around 40%).
Walkability and Democratic lean
Places with a highly walkable street grid tend to lean Democratic; Old Town, Eureka, CA sits in the top tenth nationally on this measure. A walkable street grid does not change how people vote; it mostly reflects how urban a place is.
Why turnout in Old Town looks the way it does
Renters vote less often than owners. About 70% of households in Old Town rent, about 45 points above the U.S. average of 25%. High-crime urban areas turn out at lower rates, and Old Town sits in the top 15% on a violent-crime measure. Learn more about the findings and methodology on the political spectrum map.
Nearby Neighborhoods
- The West Side, Eureka, CA D+37
- Cutten, Eureka, CA D+16
- South Bay, Eureka, CA D+14
- Jacoby Creek, Arcata, CA D+59
- Rohnerville, Fortuna, CA D+6
- Happy Valley, Anderson, CA R+43
- Enterprise, Redding, CA R+13
- Starview, Redding, CA R+27
- Columbia, Redding, CA R+35
- Pacheco, Redding, CA R+39
Neighborhoods with Similar Populations
- Victoria Gardens, Rancho Cucamonga, CA D+11
- East Phillips, Minneapolis, MN D+63
- Dexter Falls, Columbus, OH D+21
- Gresham-Southwest, Gresham, OR D+10
- Seven Bar Ranch, Albuquerque, NM D+21
- South Hagginwood, Sacramento, CA D+27
- Jacksonville Heights West, Jacksonville, FL D+27
- Apollo Arapaho and Camelot, Garland, TX D+16
- Wesconnett, Jacksonville, FL D+10
- Oakhurst, Decatur, GA D+77
Sources and methodology
Precinct-level voting records used to fit the model come from California Secretary of State, Elections, distributed by the Voting and Election Science Team. Demographic inputs come from the U.S. Census Bureau (ACS 5-year estimates and the 2020 Decennial Census). Health and environmental inputs come from the CDC (PLACES and the Environmental Justice Index). Land cover comes from the USGS and EPA. Election-day and lead-up weather come from PRISM 4km daily grids and the NOAA Global Historical Climatology Network. Mail-voting and election-administration patterns come from the MIT Election Lab's Survey of the Performance of American Elections. Block-group crime detail comes from CrimeGrade. Internet data and modeling support provided by ISPreports.org.
Modeling and analysis by the BestNeighborhood data science team. Full methodology and findings: political spectrum map.
Methodology reviewed by the BestNeighborhood data team. Last updated May 2026.