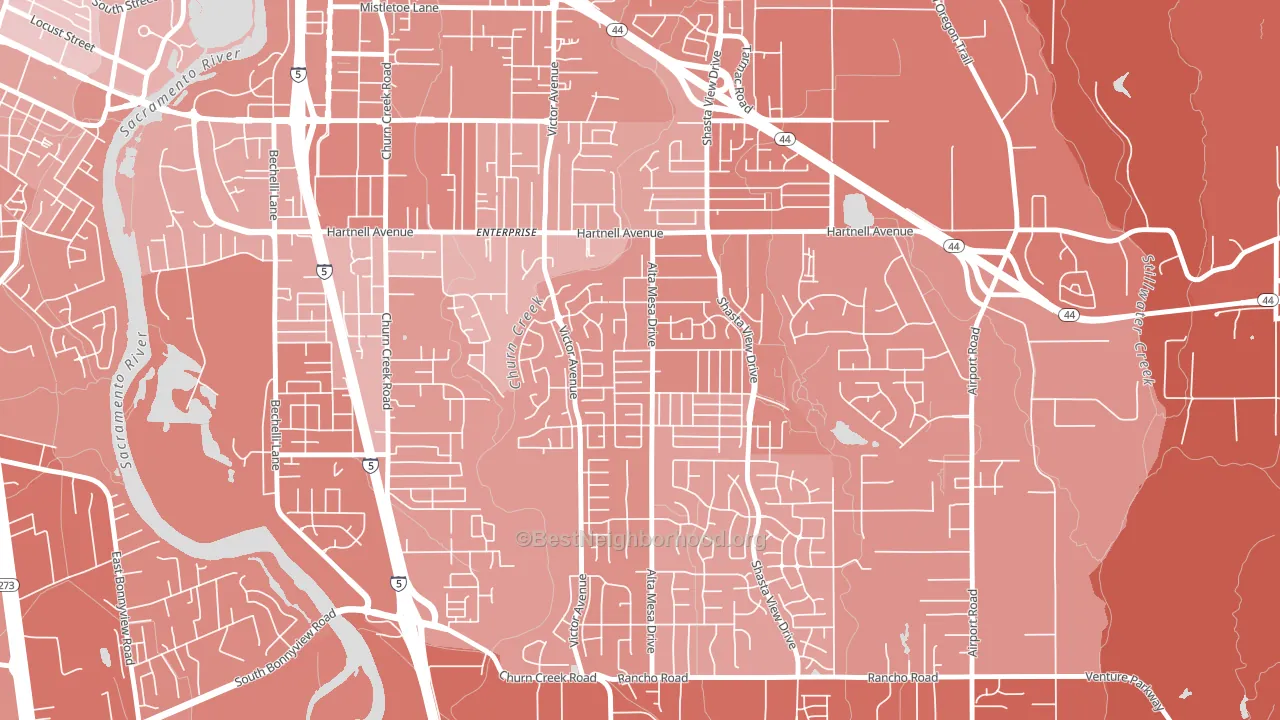
Starview leans Republican by roughly 28 points: about 36% of voters vote Democratic and 64% Republican.
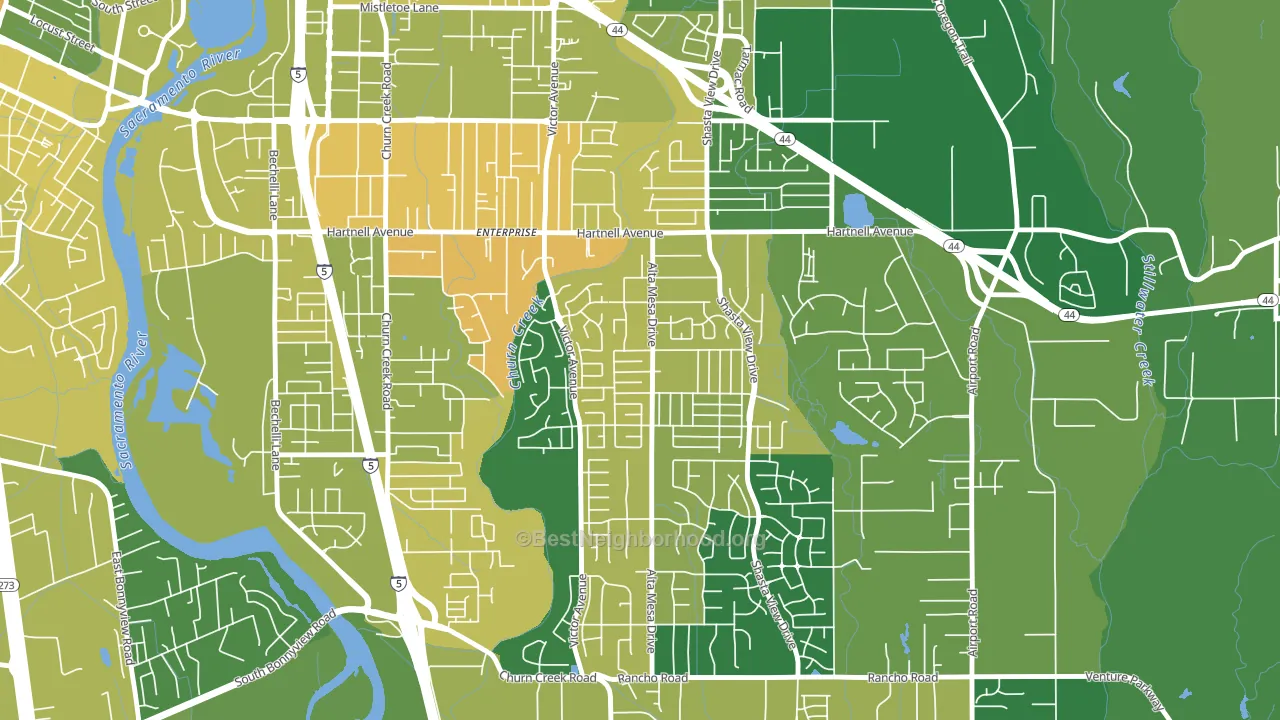
About 66% of adults in Starview typically vote, near the U.S. average of about 62%. Among adults in Starview, ~24% vote Democratic, ~42% Republican, and ~34% don't vote. The map below shows estimated turnout by block group.
How Starview compares
Among neighborhoods within 5 miles, Starview leans more Republican than 1 of 3 neighbors.
Starview runs about 47 points more Republican than California as a whole. California leans Democratic overall, while Starview is one of the few Republican-leaning pockets.
Why Starview leans the way it does
This analysis examined 14,881 data points per neighborhood to find what predicts political lean and turnout. The items below are a few correlations that stood out for Starview, not a ranked or complete list of what matters most.
Starview votes against the grain of California. California leans Democratic overall, while Starview runs about 47 points more Republican. Car-dependent areas vote Republican, and about 82% of residents in Starview drive to work alone, above 86% of neighborhoods. A high white share with below-average college attainment predicts Republican voting, and Starview fits that profile on both counts.
Uninsured rate and voter turnout
Places with a low uninsured rate tend to turn out at a higher rate; Starview, Redding, CA sits in the bottom quarter nationally on this measure. Insurance coverage does not directly drive turnout; it reflects the income and stability that line up with who votes.
Why turnout in Starview looks the way it does
Turnout in Starview sits close to the national pattern. Learn more about the findings and methodology on the political spectrum map.
Nearby Neighborhoods
- Enterprise, Redding, CA R+13
- Columbia, Redding, CA R+35
- Pacheco, Redding, CA R+39
- Cascade, Anderson, CA R+33
- Happy Valley, Anderson, CA R+43
- Jacoby Creek, Arcata, CA D+59
- Rohnerville, Fortuna, CA D+6
- Cutten, Eureka, CA D+16
- Old Town, Eureka, CA D+38
- The West Side, Eureka, CA D+37
Neighborhoods with Similar Populations
- Downtown Erie, Erie, PA D+36
- Heritage District, Gilbert, AZ D+5
- Lakeview Terrace, Kansas City, MO D+14
- SR Marmon, Albuquerque, NM D+13
- Hillsmere Shores, Annapolis Neck, MD D+19
- Arnold Heights, Lincoln, NE R+5
- Downtown Pomona, Pomona, CA D+36
- Westfield, Baltimore, MD D+66
- Clanton Park-Roseland, Charlotte, NC D+83
- Crown Meadows, San Antonio, TX D+22
Sources and methodology
Precinct-level voting records used to fit the model come from California Secretary of State, Elections, distributed by the Voting and Election Science Team. Demographic inputs come from the U.S. Census Bureau (ACS 5-year estimates and the 2020 Decennial Census). Health and environmental inputs come from the CDC (PLACES and the Environmental Justice Index). Land cover comes from the USGS and EPA. Election-day and lead-up weather come from PRISM 4km daily grids and the NOAA Global Historical Climatology Network. Mail-voting and election-administration patterns come from the MIT Election Lab's Survey of the Performance of American Elections. Block-group crime detail comes from CrimeGrade. Internet data and modeling support provided by ISPreports.org.
Modeling and analysis by the BestNeighborhood data science team. Full methodology and findings: political spectrum map.
Methodology reviewed by the BestNeighborhood data team. Last updated May 2026.