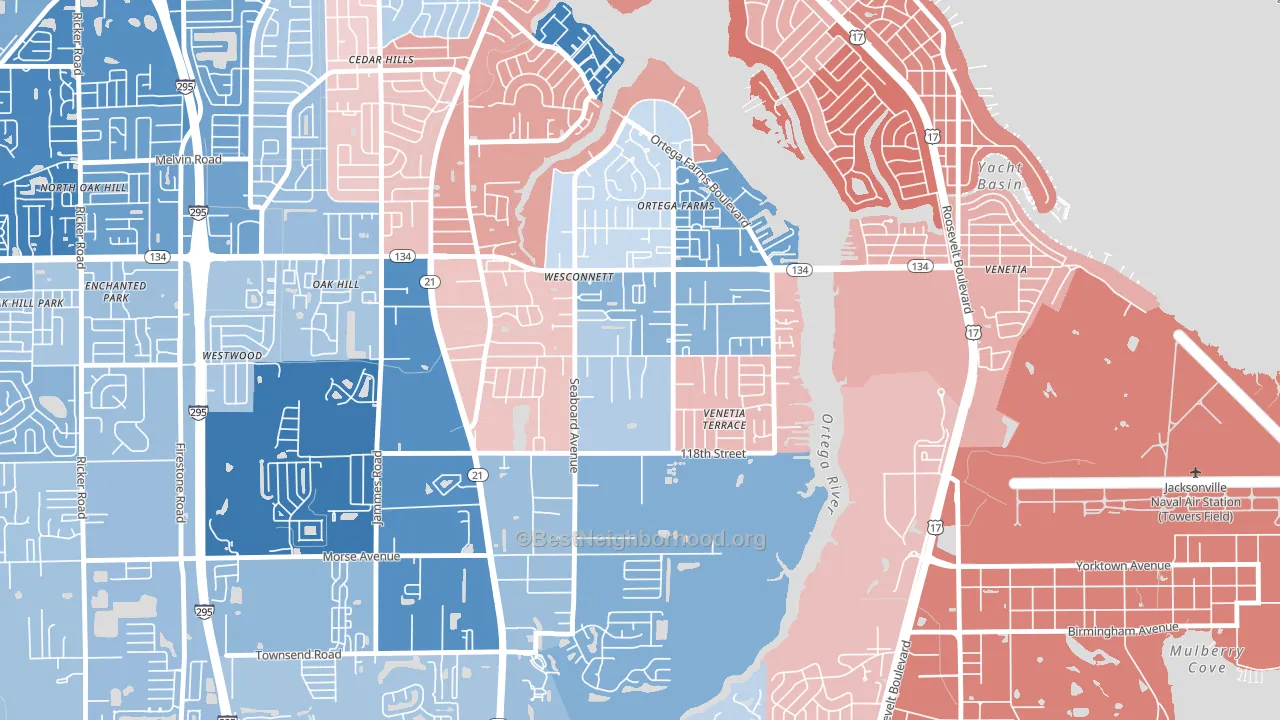
Wesconnett leans slightly Democratic by roughly 10 points: about 55% of voters vote Democratic and 45% Republican.
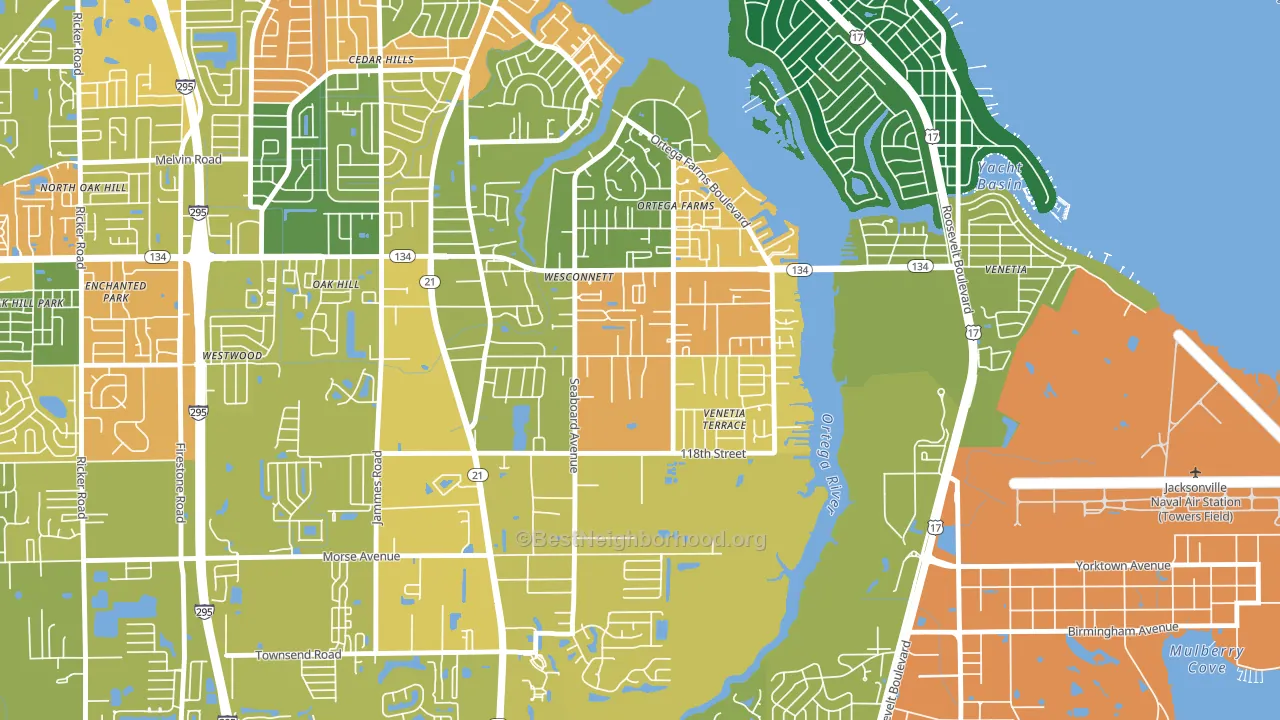
About 50% of adults in Wesconnett typically vote, below the U.S. average of about 62%. Among adults in Wesconnett, ~28% vote Democratic, ~23% Republican, and ~49% don't vote. The map below shows estimated turnout by block group.
How Wesconnett compares
Among neighborhoods within 5 miles, Wesconnett leans more Democratic than 5 of 20 neighbors.
Wesconnett runs about 23 points more Democratic than Florida as a whole. Florida leans Republican overall, while Wesconnett is one of the few Democratic-leaning pockets.
Politics vary noticeably by block within Wesconnett. The northeast side runs the most Democratic (D+28) and the southeast side runs the most Republican (R+3), a spread of about 30 points.
Why Wesconnett leans the way it does
This analysis examined 14,881 data points per neighborhood to find what predicts political lean and turnout. The items below are a few correlations that stood out for Wesconnett, not a ranked or complete list of what matters most.
Wesconnett votes against the grain of Florida. Florida leans Republican overall, while Wesconnett runs about 23 points more Democratic.
Adult tooth loss and voter turnout
Places with a high adult tooth-loss rate tend to turn out at a lower rate; Wesconnett, Jacksonville, FL sits in the top quarter nationally on this measure. Tooth loss does not drive turnout; it reflects age, income, and healthcare access.
Why turnout in Wesconnett looks the way it does
Areas with limited routine healthcare access turn out at lower rates. Wesconnett is in the bottom quarter nationally for routine-care measures such as insurance coverage, preventive screenings, and dental visits. The dental-visit rate here is about 42%, about 14 points below the Florida average of 56%. Learn more about the findings and methodology on the political spectrum map.
Nearby Neighborhoods
- Ortega Farms, Jacksonville, FL D+11
- Confederate Point, Jacksonville, FL D+20
- Duclay Forest, Jacksonville, FL D+32
- Oak Hill, Jacksonville, FL D+31
- Cedar Hills, Jacksonville, FL D+17
- Cedar Hills Estates, Jacksonville, FL D+10
- Duclay, Jacksonville, FL D+17
- Lakeshore, Jacksonville, FL R+14
- Ortega Hills, Jacksonville, FL D+11
- McGirts Creek, Jacksonville, FL D+19
Neighborhoods with Similar Populations
- Abilene Heights Area, Abilene, TX R+24
- Apollo Arapaho and Camelot, Garland, TX D+16
- Shoreview, San Mateo, CA D+44
- La Colonia, Oxnard, CA D+39
- Jacksonville Heights West, Jacksonville, FL D+27
- South Hagginwood, Sacramento, CA D+27
- Seven Bar Ranch, Albuquerque, NM D+21
- Dexter Falls, Columbus, OH D+21
- Victoria Gardens, Rancho Cucamonga, CA D+11
- Old Town, Eureka, CA D+38
Sources and methodology
Precinct-level voting records used to fit the model come from Florida Division of Elections, distributed by the Voting and Election Science Team. Demographic inputs come from the U.S. Census Bureau (ACS 5-year estimates and the 2020 Decennial Census). Health and environmental inputs come from the CDC (PLACES and the Environmental Justice Index). Land cover comes from the USGS and EPA. Election-day and lead-up weather come from PRISM 4km daily grids and the NOAA Global Historical Climatology Network. Mail-voting and election-administration patterns come from the MIT Election Lab's Survey of the Performance of American Elections. Block-group crime detail comes from CrimeGrade. Internet data and modeling support provided by ISPreports.org.
Modeling and analysis by the BestNeighborhood data science team. Full methodology and findings: political spectrum map.
Methodology reviewed by the BestNeighborhood data team. Last updated May 2026.