Onyx is a Democratic stronghold. About 93% of voters here vote Democratic and 7% Republican.
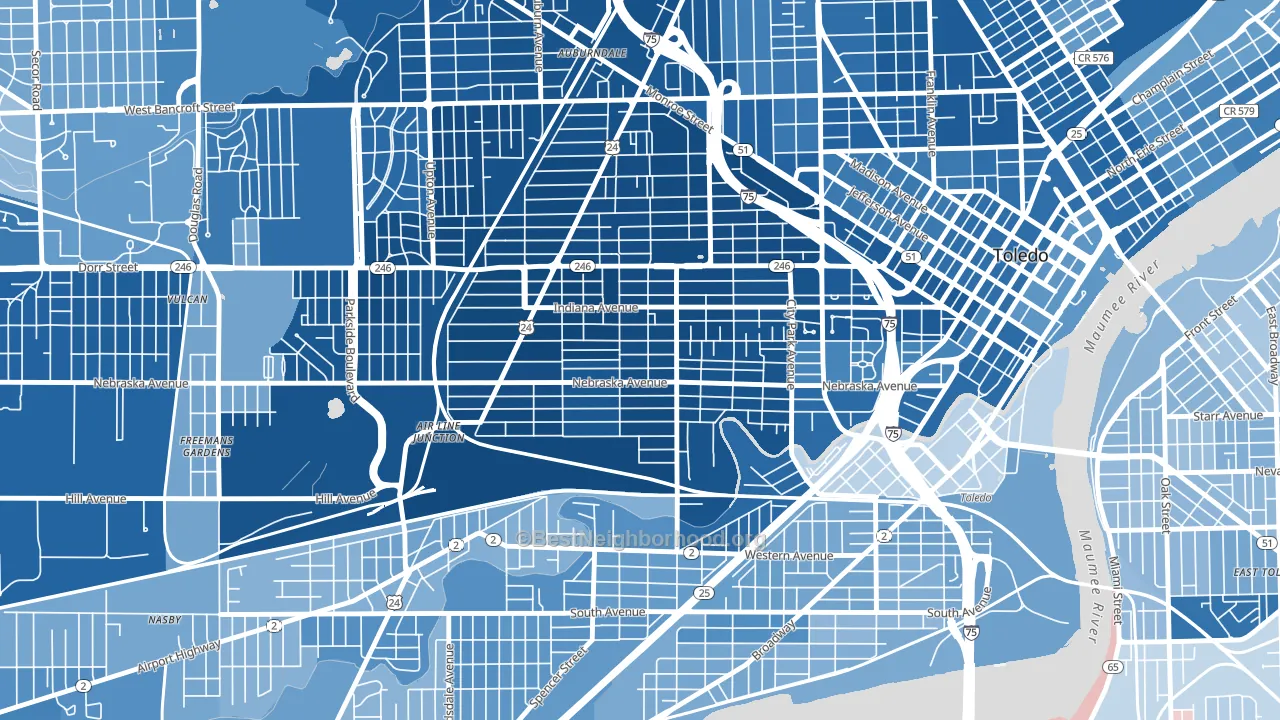
About 67% of adults in Onyx typically vote, near the U.S. average of about 62%. Among adults in Onyx, ~62% vote Democratic, ~5% Republican, and ~33% don't vote. The map below shows estimated turnout by block group.
How Onyx compares
Among neighborhoods within 5 miles, Onyx leans more Democratic than 16 of 17 neighbors.
Onyx runs about 98 points more Democratic than Ohio as a whole. Ohio leans Republican overall, while Onyx is one of the few Democratic-leaning pockets.
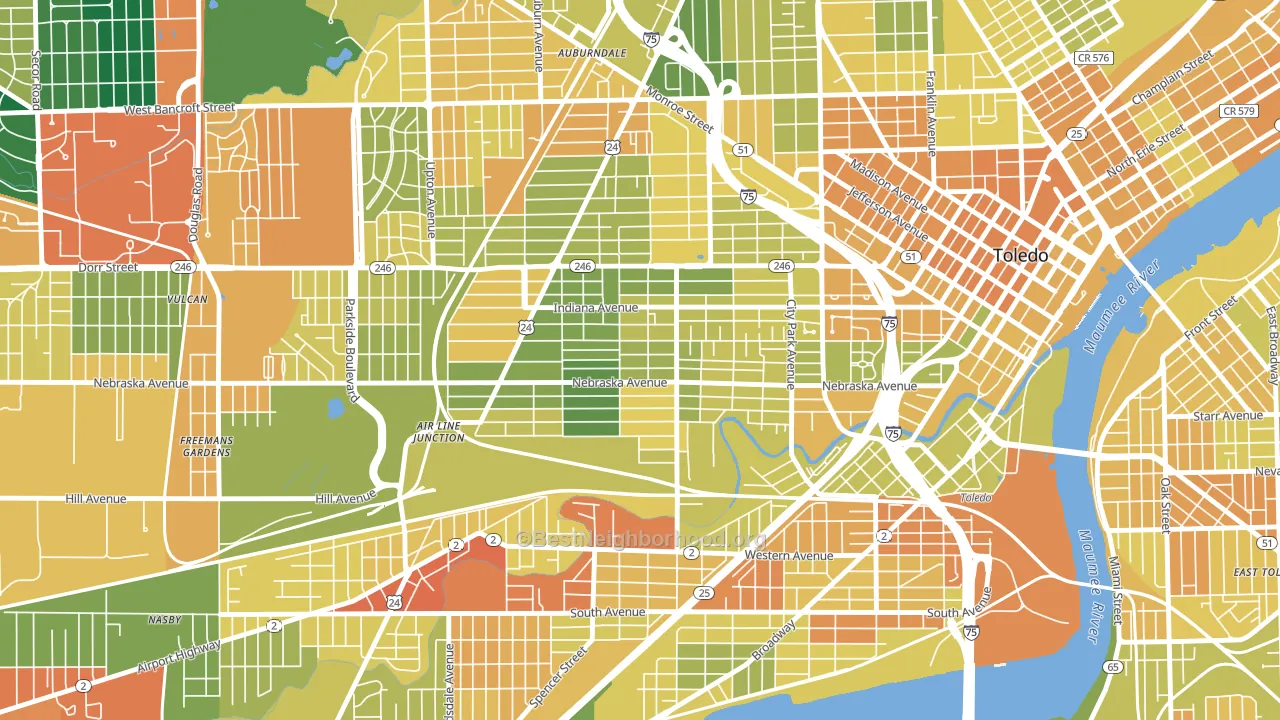
Politics vary noticeably by block within Onyx. The southwest side is the most Democratic-leaning (D+91) and the east side is the least Democratic-leaning (D+69), a spread of about 22 points.
Why Onyx leans the way it does
This analysis examined 14,881 data points per neighborhood to find what predicts political lean and turnout. The items below are a few correlations that stood out for Onyx, not a ranked or complete list of what matters most.
Onyx votes against the grain of Ohio. Ohio leans Republican overall, while Onyx runs about 98 points more Democratic. A high never-married share predicts Democratic voting, and about 51% of adults in Onyx have never been married, above 83% of neighborhoods.
Preventive-care access and voter turnout
Places with limited routine preventive-care access tend to turn out at a lower rate; Onyx, Toledo, OH sits in the bottom tenth nationally on this measure. Dental visits do not drive turnout; the rate reflects income, insurance, and healthcare access, which line up with who votes.
Why turnout in Onyx looks the way it does
Turnout in Onyx sits close to the national pattern. Learn more about the findings and methodology on the political spectrum map.
Nearby Neighborhoods
- Roosevelt-Toledo, Toledo, OH D+89
- Southside, Toledo, OH D+34
- City Center, Toledo, OH D+58
- Old West End, Toledo, OH D+75
- Ottawa, Toledo, OH D+55
- Olde Towne, Toledo, OH D+70
- Scott Park, Toledo, OH D+61
- LaGrange, Toledo, OH D+65
- East Toledo, Toledo, OH D+15
- North River, Toledo, OH D+44
Neighborhoods with Similar Populations
- Park Forest, Kansas City, MO D+12
- North Central Loma Linda, Loma Linda, CA D+11
- Rio Lindo, Oxnard, CA D+31
- Woodlands-Pleasantview, Duluth, MN D+30
- Summit Lake, Akron, OH D+50
- Houghton, Kirkland, WA D+47
- Stevens Square, Minneapolis, MN D+71
- Enfield Estates, Edinburg, TX R+2
- Allwood, Clifton, NJ Even
- Uptown, Albuquerque, NM D+30
Sources and methodology
Precinct-level voting records used to fit the model come from Ohio Secretary of State, Elections, distributed by the Voting and Election Science Team. Demographic inputs come from the U.S. Census Bureau (ACS 5-year estimates and the 2020 Decennial Census). Health and environmental inputs come from the CDC (PLACES and the Environmental Justice Index). Land cover comes from the USGS and EPA. Election-day and lead-up weather come from PRISM 4km daily grids and the NOAA Global Historical Climatology Network. Mail-voting and election-administration patterns come from the MIT Election Lab's Survey of the Performance of American Elections. Block-group crime detail comes from CrimeGrade. Internet data and modeling support provided by ISPreports.org.
Modeling and analysis by the BestNeighborhood data science team. Full methodology and findings: political spectrum map.
Methodology reviewed by the BestNeighborhood data team. Last updated May 2026.