Roosevelt-Toledo is a Democratic stronghold. About 94% of voters here vote Democratic and 6% Republican.
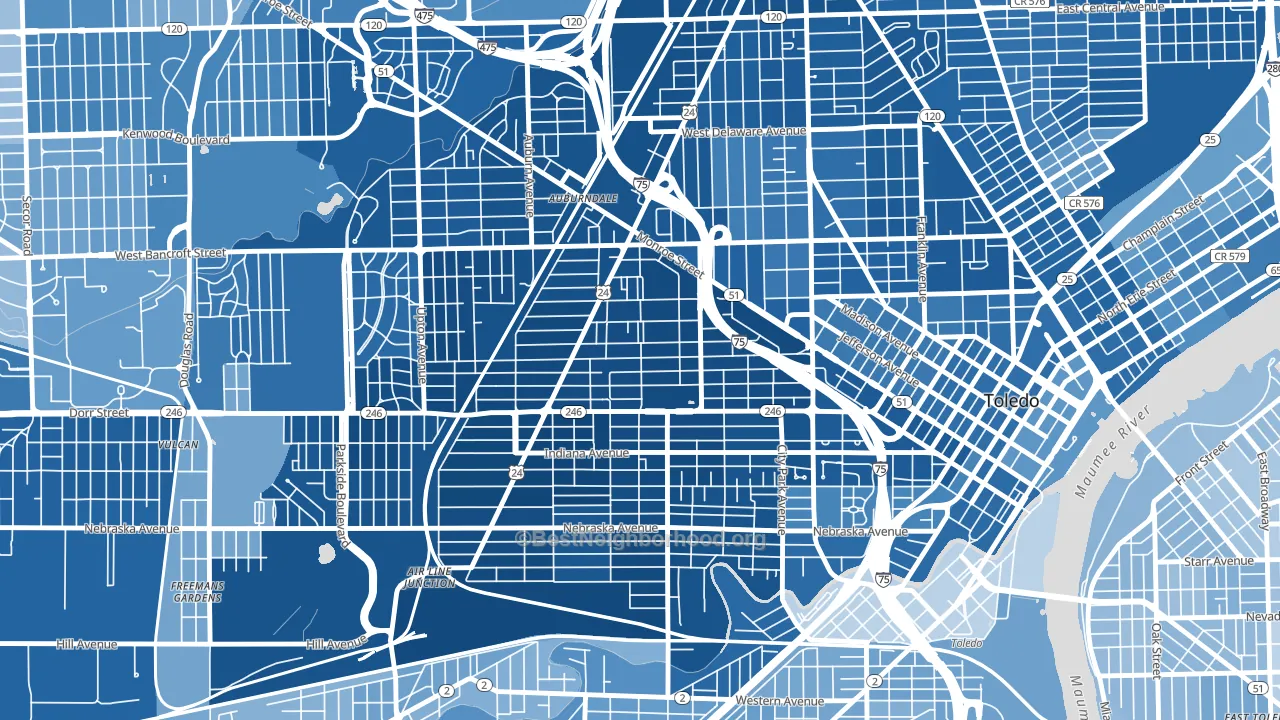
About 61% of adults in Roosevelt-Toledo typically vote, near the U.S. average of about 62%. Among adults in Roosevelt-Toledo, ~57% vote Democratic, ~4% Republican, and ~39% don't vote. The map below shows estimated turnout by block group.
How Roosevelt-Toledo compares
Among neighborhoods within 5 miles, Roosevelt-Toledo is the most Democratic-leaning.
Roosevelt-Toledo runs about 100 points more Democratic than Ohio as a whole. Ohio leans Republican overall, while Roosevelt-Toledo is one of the few Democratic-leaning pockets.
Why Roosevelt-Toledo leans the way it does
This analysis examined 14,881 data points per neighborhood to find what predicts political lean and turnout. The items below are a few correlations that stood out for Roosevelt-Toledo, not a ranked or complete list of what matters most.
Density combined with diversity predicts Democratic voting. Non-Hispanic white share in Roosevelt-Toledo is about 5%, about 67 points below the U.S. average of 72%. A high never-married share predicts Democratic voting, and about 60% of adults in Roosevelt-Toledo have never been married, above 93% of neighborhoods. Roosevelt-Toledo runs against the grain of Ohio, a Democratic-leaning pocket in a Republican-leaning state.
Paved land cover and Democratic lean
Places with extensive paved surfaces tend to lean Democratic; Roosevelt-Toledo, Toledo, OH sits in the top quarter nationally on this measure. Paved ground does not change how people vote; it mostly reflects how urban and built-up a place is.
Why turnout in Roosevelt-Toledo looks the way it does
Areas with high food insecurity turn out at lower rates. About 44% of adults in Roosevelt-Toledo report food insecurity, about 28 points above the U.S. average of 16%. Limited routine healthcare access lines up with lower turnout, and Roosevelt-Toledo sits in the bottom quarter on routine-care measures. High-crime urban areas turn out at lower rates, and Roosevelt-Toledo sits in the top 15% on a violent-crime measure. Learn more about the findings and methodology on the political spectrum map.
Nearby Neighborhoods
- Onyx, Toledo, OH D+86
- Old West End, Toledo, OH D+75
- City Center, Toledo, OH D+58
- Olde Towne, Toledo, OH D+70
- Southside, Toledo, OH D+34
- Ottawa, Toledo, OH D+55
- LaGrange, Toledo, OH D+65
- Scott Park, Toledo, OH D+61
- Five Points, Toledo, OH D+28
- North River, Toledo, OH D+44
Neighborhoods with Similar Populations
- Morristown Historic District, Morristown, NJ D+27
- Monterey, Jacksonville, FL D+15
- Mosswood, Oakland, CA D+82
- Shingle Creek, Minneapolis, MN D+47
- Harlan Ranch, Clovis, CA R+17
- Rock Spring, Arlington, VA D+43
- Northridge, Orem, UT R+31
- Colonial Avenue Area, Roanoke, VA D+20
- San Antonio Creekside, San Antonio, TX D+11
- North Main Historic District, Mount Vernon, OH R+36
Sources and methodology
Precinct-level voting records used to fit the model come from Ohio Secretary of State, Elections, distributed by the Voting and Election Science Team. Demographic inputs come from the U.S. Census Bureau (ACS 5-year estimates and the 2020 Decennial Census). Health and environmental inputs come from the CDC (PLACES and the Environmental Justice Index). Land cover comes from the USGS and EPA. Election-day and lead-up weather come from PRISM 4km daily grids and the NOAA Global Historical Climatology Network. Mail-voting and election-administration patterns come from the MIT Election Lab's Survey of the Performance of American Elections. Block-group crime detail comes from CrimeGrade. Internet data and modeling support provided by ISPreports.org.
Modeling and analysis by the BestNeighborhood data science team. Full methodology and findings: political spectrum map.
Methodology reviewed by the BestNeighborhood data team. Last updated May 2026.