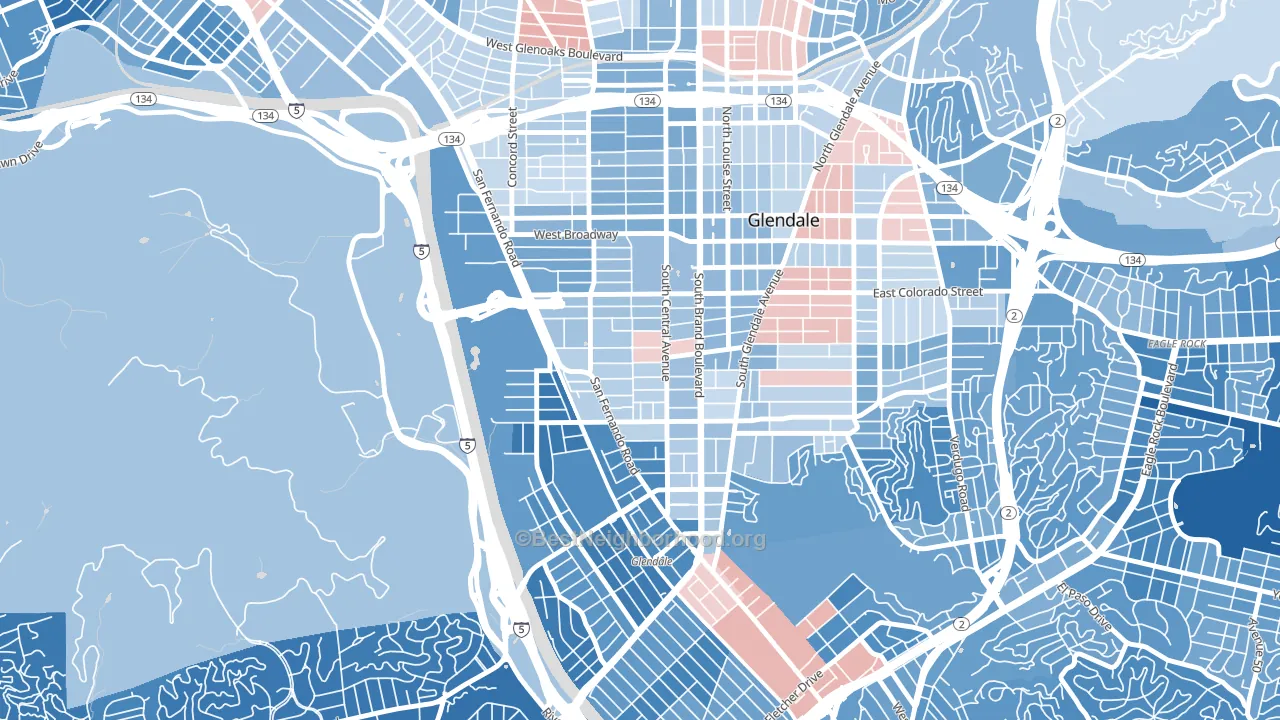
Pacific Edison leans Democratic by roughly 18 points: about 59% of voters vote Democratic and 41% Republican.
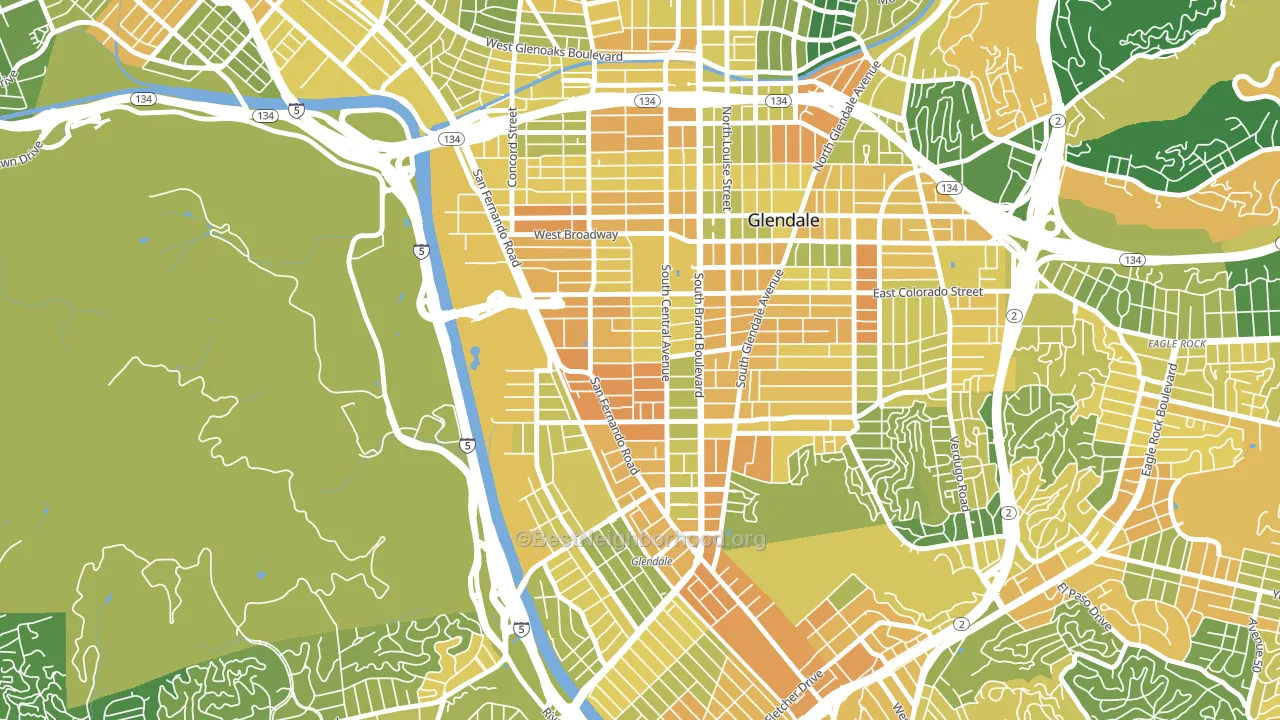
About 42% of adults in Pacific Edison typically vote, below the U.S. average of about 62%. Among adults in Pacific Edison, ~25% vote Democratic, ~17% Republican, and ~58% don't vote. The map below shows estimated turnout by block group.
How Pacific Edison compares
Among neighborhoods within 5 miles, Pacific Edison leans more Democratic than 9 of 29 neighbors.
Politically, Pacific Edison sits close to the rest of California.
Politics vary noticeably by block within Pacific Edison. The southeast side is the most Democratic-leaning (D+27) and the north side is the least Democratic-leaning (D+11), a spread of about 16 points.
Why Pacific Edison leans the way it does
This analysis examined 14,881 data points per neighborhood to find what predicts political lean and turnout. The items below are a few correlations that stood out for Pacific Edison, not a ranked or complete list of what matters most.
Dense areas vote Democratic. More than 99% of residents in Pacific Edison live in densely developed areas, about 64 points above the U.S. average of 36%.
Population density and Democratic lean
Places with high population density tend to lean Democratic; Pacific Edison, Glendale, CA sits in the top tenth nationally on this measure.
Why turnout in Pacific Edison looks the way it does
Renters vote less often than owners. About 95% of households in Pacific Edison rent, about 70 points above the U.S. average of 25%. Crowded housing lines up with lower turnout, and about 14% of homes in Pacific Edison have more than one occupant per room, above 95% of neighborhoods. Learn more about the findings and methodology on the political spectrum map.
Nearby Neighborhoods
- Tropico, Glendale, CA D+18
- Mariposa, Glendale, CA D+9
- Vineyard-Los Angeles, Glendale, CA D+18
- City Center, Glendale, CA D+18
- Adams Hill, Glendale, CA D+25
- Atwater Village, Los Angeles, CA D+53
- Fremont Park, Glendale, CA D+12
- Citrus Grove, Glendale, CA D+5
- Somerset, Glendale, CA D+23
- Rossmoyne, Glendale, CA D+13
Neighborhoods with Similar Populations
- Lowry Hill East, Minneapolis, MN D+75
- Ducktown, Chicago, IL D+35
- South Linden, Columbus, OH D+75
- Calumet Heights, Chicago, IL D+85
- Sunset Hill, Staten Island, NY R+14
- Oak View, Huntington Beach, CA D+13
- Brighton, Seattle, WA D+64
- The Cape, Jacksonville, FL R+9
- University Of Texas, Austin, TX D+67
- Greater Harmony Hills, San Antonio, TX D+14
Sources and methodology
Precinct-level voting records used to fit the model come from California Secretary of State, Elections, distributed by the Voting and Election Science Team. Demographic inputs come from the U.S. Census Bureau (ACS 5-year estimates and the 2020 Decennial Census). Health and environmental inputs come from the CDC (PLACES and the Environmental Justice Index). Land cover comes from the USGS and EPA. Election-day and lead-up weather come from PRISM 4km daily grids and the NOAA Global Historical Climatology Network. Mail-voting and election-administration patterns come from the MIT Election Lab's Survey of the Performance of American Elections. Block-group crime detail comes from CrimeGrade. Internet data and modeling support provided by ISPreports.org.
Modeling and analysis by the BestNeighborhood data science team. Full methodology and findings: political spectrum map.
Methodology reviewed by the BestNeighborhood data team. Last updated May 2026.