Ducktown leans heavily Democratic by roughly 34 points: about 67% of voters vote Democratic and 33% Republican.
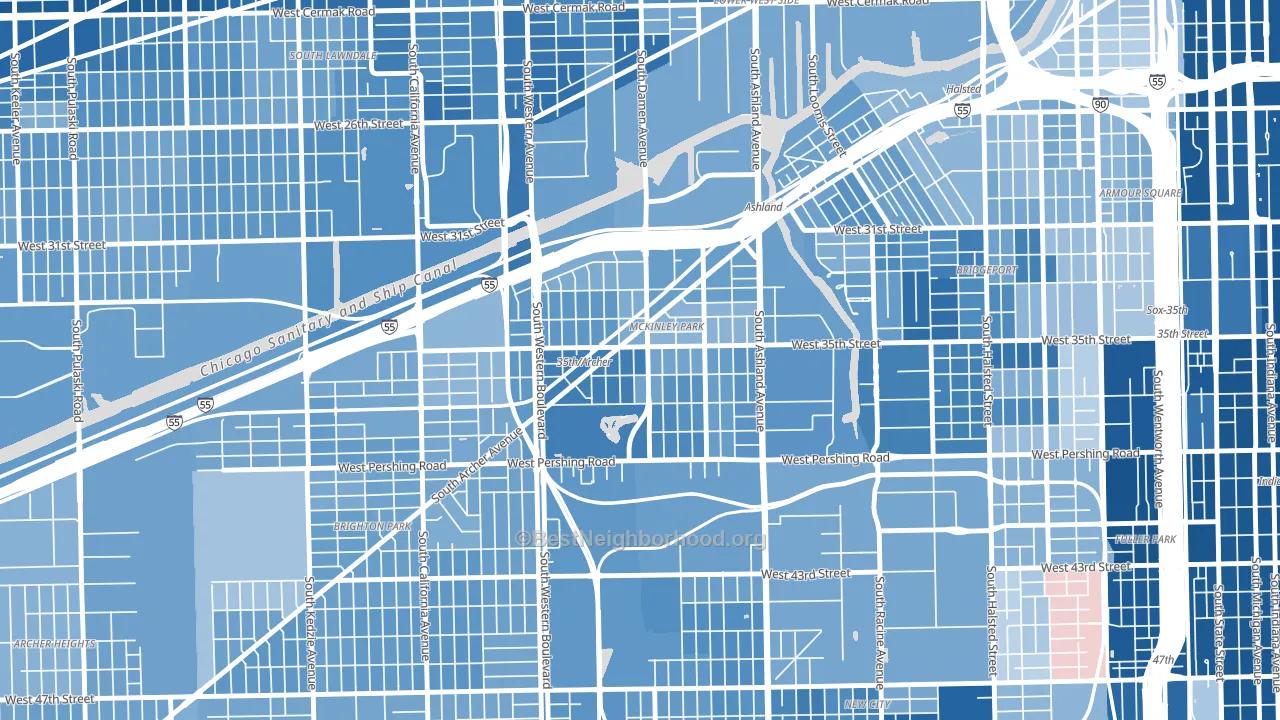
About 42% of adults in Ducktown typically vote, below the U.S. average of about 62%. Among adults in Ducktown, ~28% vote Democratic, ~14% Republican, and ~58% don't vote. The map below shows estimated turnout by block group.
How Ducktown compares
Among neighborhoods within 5 miles, Ducktown leans more Democratic than 10 of 45 neighbors.
Ducktown runs about 24 points more Democratic than Illinois as a whole.
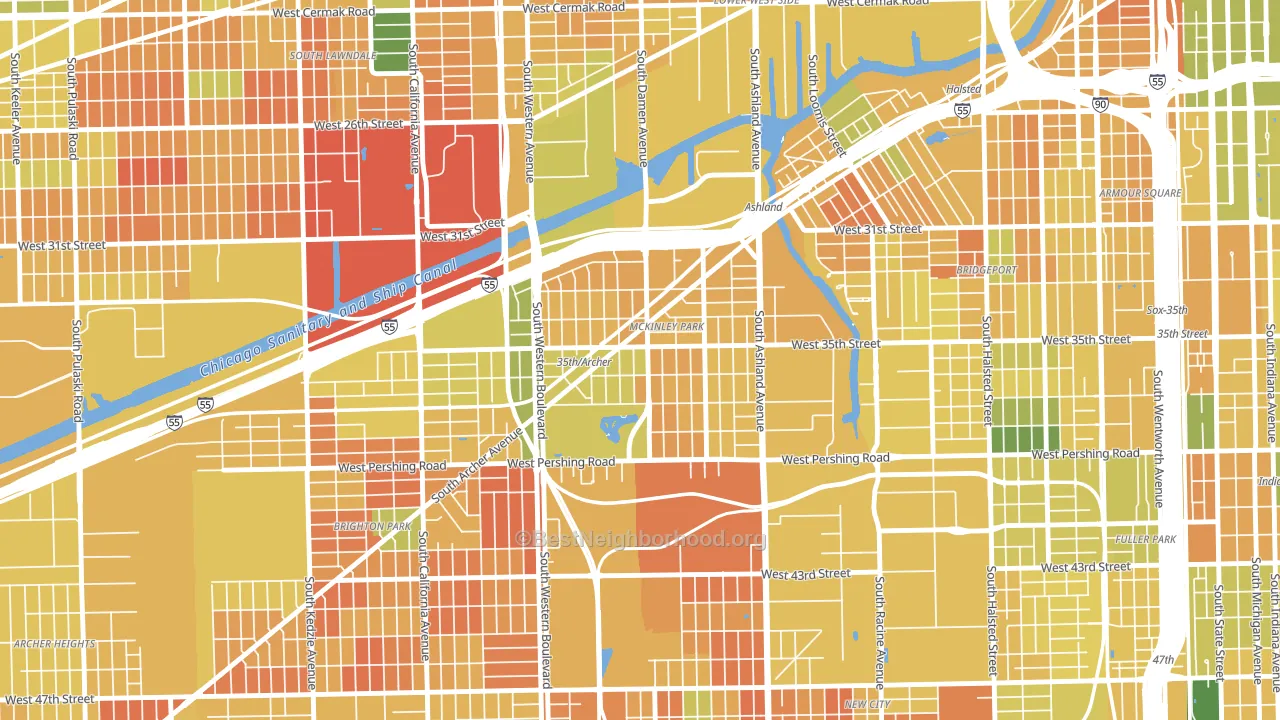
Politics vary noticeably by block within Ducktown. The southwest side is the most Democratic-leaning (D+43) and the northeast side is the least Democratic-leaning (D+24), a spread of about 19 points.
Why Ducktown leans the way it does
Density, race composition, education, and family structure all sit close to their national averages in Ducktown. The lean here lands roughly where demographic data alone would predict.
Population density and Democratic lean
Places with high population density tend to lean Democratic; Ducktown, Chicago, IL sits in the top tenth nationally on this measure.
Why turnout in Ducktown looks the way it does
Areas with limited routine healthcare access turn out at lower rates. Ducktown is in the bottom quarter nationally for routine-care measures such as insurance coverage, preventive screenings, and dental visits. Learn more about the findings and methodology on the political spectrum map.
Nearby Neighborhoods
- Mount Pleasant, Chicago, IL D+28
- Locks, Chicago, IL D+30
- Brighton Park, Chicago, IL D+32
- Corwith, Chicago, IL D+30
- Bridgeport, Chicago, IL D+27
- Back of the Yards, Chicago, IL D+46
- Lower West Side, Chicago, IL D+58
- Bohemian California, Chicago, IL D+46
- Pilsen, Chicago, IL D+62
- South Lawndale, Chicago, IL D+41
Neighborhoods with Similar Populations
- Lowry Hill East, Minneapolis, MN D+75
- Pacific Edison, Glendale, CA D+18
- South Linden, Columbus, OH D+75
- Calumet Heights, Chicago, IL D+85
- Brighton, Seattle, WA D+64
- Sunset Hill, Staten Island, NY R+14
- The Cape, Jacksonville, FL R+9
- University Of Texas, Austin, TX D+67
- Newton Corner, Newton, MA D+65
- Oak View, Huntington Beach, CA D+13
Sources and methodology
Precinct-level voting records used to fit the model come from Illinois State Board of Elections, distributed by the Voting and Election Science Team. Demographic inputs come from the U.S. Census Bureau (ACS 5-year estimates and the 2020 Decennial Census). Health and environmental inputs come from the CDC (PLACES and the Environmental Justice Index). Land cover comes from the USGS and EPA. Election-day and lead-up weather come from PRISM 4km daily grids and the NOAA Global Historical Climatology Network. Mail-voting and election-administration patterns come from the MIT Election Lab's Survey of the Performance of American Elections. Block-group crime detail comes from CrimeGrade. Internet data and modeling support provided by ISPreports.org.
Modeling and analysis by the BestNeighborhood data science team. Full methodology and findings: political spectrum map.
Methodology reviewed by the BestNeighborhood data team. Last updated May 2026.