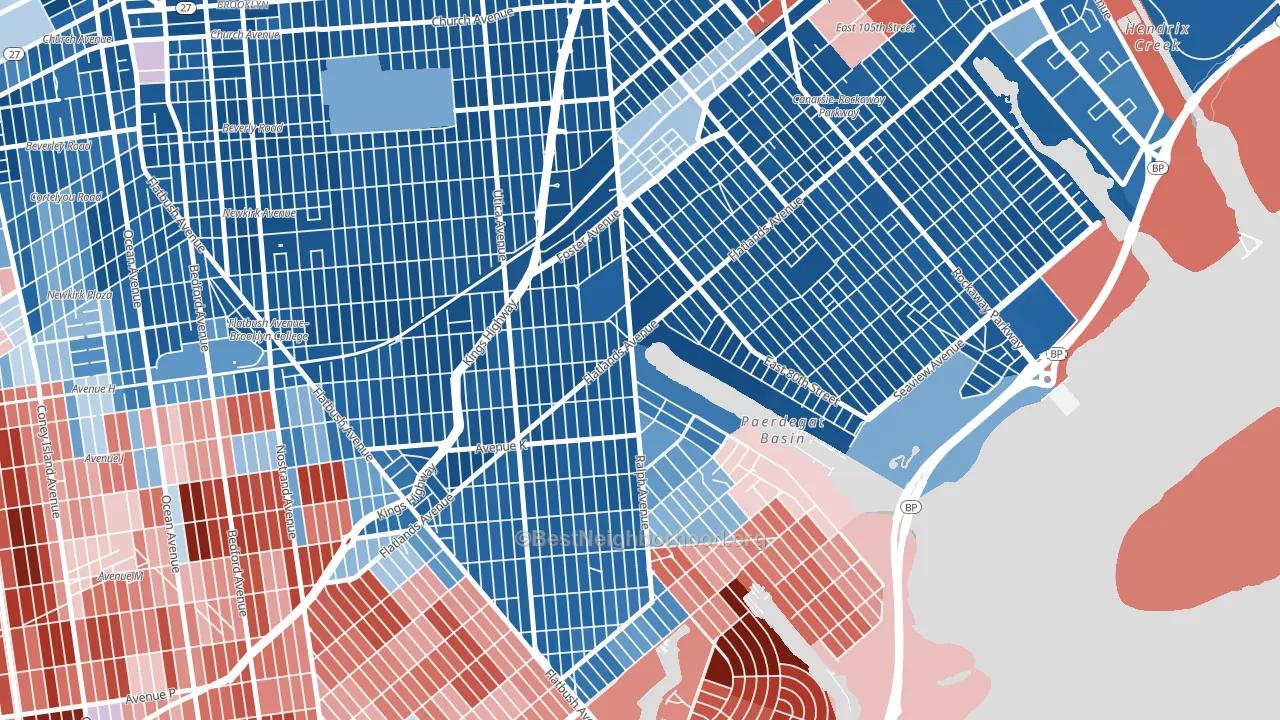
Paerdegat is a Democratic stronghold. About 89% of voters here vote Democratic and 11% Republican.
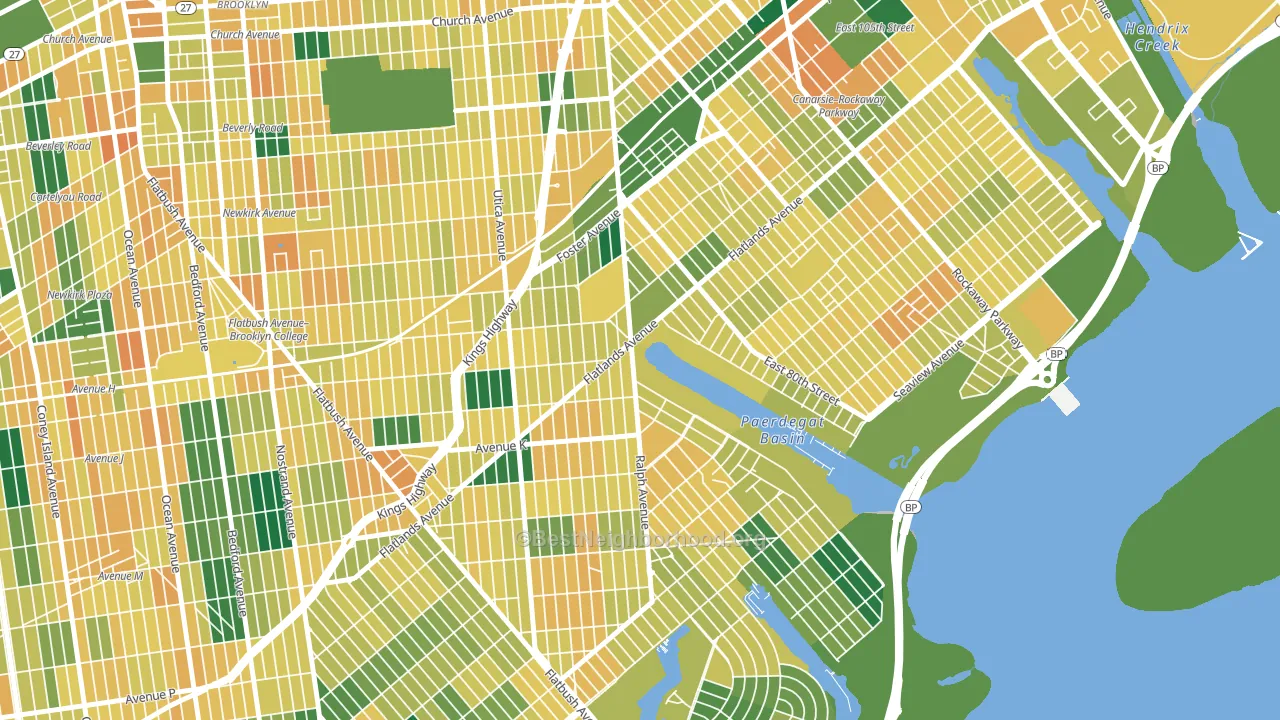
About 56% of adults in Paerdegat typically vote, below the U.S. average of about 62%. Among adults in Paerdegat, ~50% vote Democratic, ~6% Republican, and ~44% don't vote. The map below shows estimated turnout by block group.
How Paerdegat compares
Among neighborhoods within 5 miles, Paerdegat leans more Democratic than 24 of 28 neighbors.
Paerdegat runs about 66 points more Democratic than New York as a whole.
Politics vary noticeably by block within Paerdegat. The west side is the most Democratic-leaning (D+86) and the southeast side is the least Democratic-leaning (D+48), a spread of about 38 points.
Why Paerdegat leans the way it does
Density, race composition, education, and family structure all sit close to their national averages in Paerdegat. The lean here lands roughly where demographic data alone would predict.
Population density and Democratic lean
Places with high population density tend to lean Democratic; Paerdegat, Brooklyn, NY sits in the top tenth nationally on this measure.
Why turnout in Paerdegat looks the way it does
Crowded housing lines up with lower turnout. About 6% of homes in Paerdegat have more than one occupant per room, above 82% of neighborhoods. Learn more about the findings and methodology on the political spectrum map.
Nearby Neighborhoods
- Canarsie, Brooklyn, NY D+70
- Bergen Beach, Brooklyn, NY R+24
- Brownsville, Brooklyn, NY D+78
- East Flatbush, Brooklyn, NY D+81
- Mapleton-Flatlands, Brooklyn, NY D+4
- Flatbush-Ditmas Park, Brooklyn, NY D+84
- Ditmas Park, Brooklyn, NY D+69
- Prospect Lefferts Gardens, Brooklyn, NY D+84
- Crown Heights, Brooklyn, NY D+59
- Sheepshead Bay, Brooklyn, NY R+33
Neighborhoods with Similar Populations
- Clinton, Manhattan, NY D+64
- Parkway Village-Oakhaven, Memphis, TN D+73
- Green Valley North, Henderson, NV D+10
- River Oaks-Kirby-Balmoral, Memphis, TN D+30
- Park, Stockton, CA D+26
- Kalihi-Palama, Honolulu, HI D+11
- Hyde Park, Los Angeles, CA D+70
- TCU-West Cliff, Fort Worth, TX D+6
- Financial District, Manhattan, NY D+58
- Charleston Heights, Las Vegas, NV D+15
Sources and methodology
Precinct-level voting records used to fit the model come from New York State Board of Elections, distributed by the Voting and Election Science Team. Demographic inputs come from the U.S. Census Bureau (ACS 5-year estimates and the 2020 Decennial Census). Health and environmental inputs come from the CDC (PLACES and the Environmental Justice Index). Land cover comes from the USGS and EPA. Election-day and lead-up weather come from PRISM 4km daily grids and the NOAA Global Historical Climatology Network. Mail-voting and election-administration patterns come from the MIT Election Lab's Survey of the Performance of American Elections. Block-group crime detail comes from CrimeGrade. Internet data and modeling support provided by ISPreports.org.
Modeling and analysis by the BestNeighborhood data science team. Full methodology and findings: political spectrum map.
Methodology reviewed by the BestNeighborhood data team. Last updated May 2026.