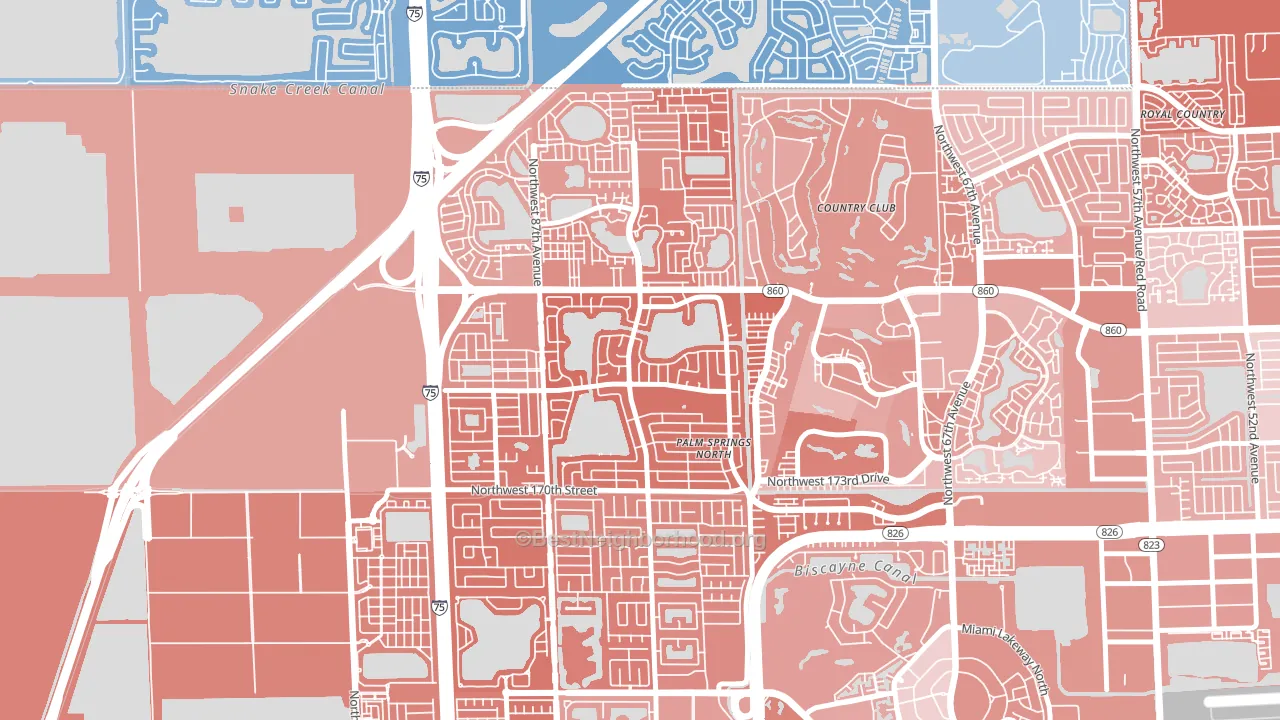
Palm Springs North leans heavily Republican by roughly 46 points: about 27% of voters vote Democratic and 73% Republican.
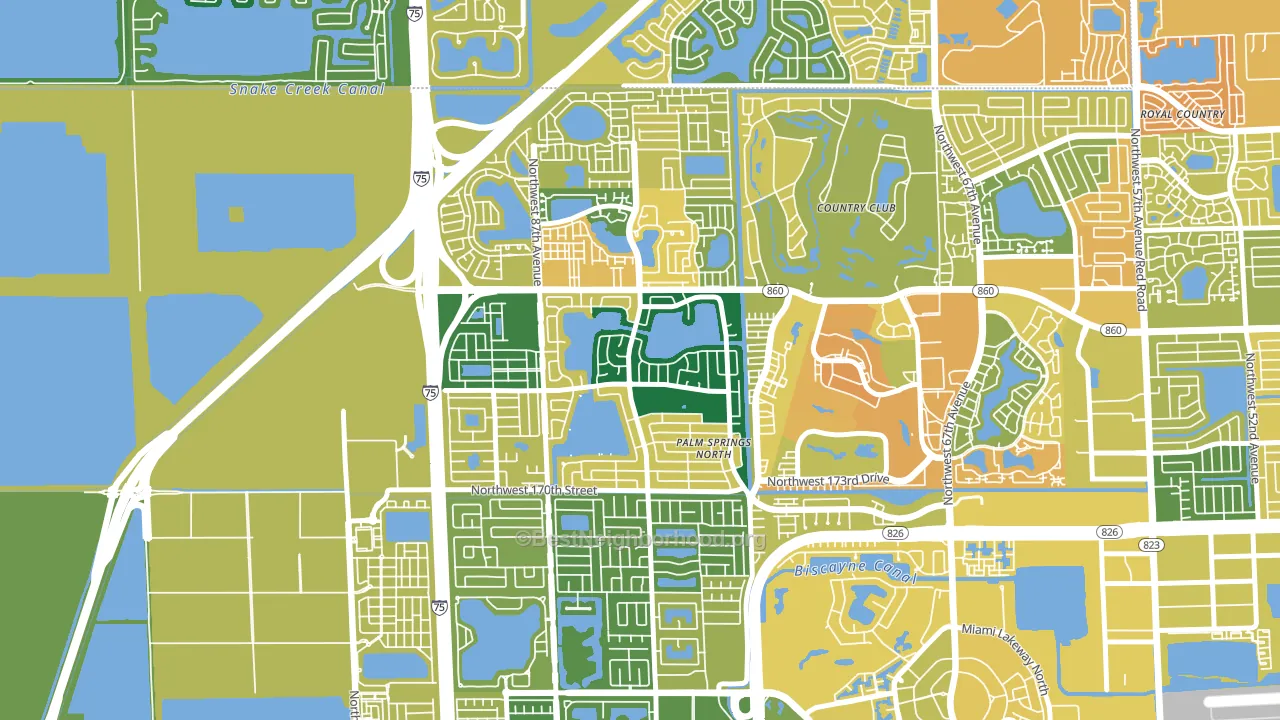
About 71% of adults in Palm Springs North typically vote, above the U.S. average of about 62%. Among adults in Palm Springs North, ~19% vote Democratic, ~52% Republican, and ~29% don't vote. The map below shows estimated turnout by block group.
How Palm Springs North compares
Palm Springs North runs about 34 points more Republican than Florida as a whole.
Why Palm Springs North leans the way it does
This analysis examined 14,881 data points per neighborhood to find what predicts political lean and turnout. The items below are a few correlations that stood out for Palm Springs North, not a ranked or complete list of what matters most.
Areas with many family households vote Republican. About 84% of households in Palm Springs North are family households, about 17 points above the U.S. average of 67%.
Homeownership and voter turnout
Places with homeowner-heavy households tend to turn out at a higher rate; Palm Springs North, Hialeah, FL sits in the top quarter nationally on this measure.
Why turnout in Palm Springs North looks the way it does
Areas with limited routine healthcare access turn out at lower rates. Palm Springs North is in the bottom quarter nationally for routine-care measures such as insurance coverage, preventive screenings, and dental visits. The uninsured rate here is about 28%, about 13 points above the Florida average of 15%. Learn more about the findings and methodology on the political spectrum map.
Nearby Neighborhoods
- Country Lakes, Miramar, FL D+15
- Silver Lakes, Pembroke Pines, FL D+16
- Pembroke Falls, Pembroke Pines, FL D+11
- Lakeshore at University Park, Miramar, FL D+58
- Wynken Blynken anchor Nod, Hialeah, FL R+43
- Embassy Lakes, Cooper City, FL D+5
- Walnut Creek, Pembroke Pines, FL D+18
- Beverly Park, Hollywood, FL D+29
- Driftwood, Hollywood, FL D+6
- 441 Corridor, Hollywood, FL D+11
Neighborhoods with Similar Populations
- Northwest Everett, Everett, WA D+39
- Fairlane, Kansas City, MO D+58
- Mays Chapel Village, Mays Chapel, MD D+13
- Washington Park, Hollywood, FL D+62
- Presidential Park, Riverside, CA D+5
- John Ball Park, Grand Rapids, MI D+31
- Como, Fort Worth, TX D+65
- Washington Park, Milwaukee, WI D+68
- Greek Track, Simi Valley, CA Even
- Historic Old Northeast, St. Petersburg, FL D+23
Sources and methodology
Precinct-level voting records used to fit the model come from Florida Division of Elections, distributed by the Voting and Election Science Team. Demographic inputs come from the U.S. Census Bureau (ACS 5-year estimates and the 2020 Decennial Census). Health and environmental inputs come from the CDC (PLACES and the Environmental Justice Index). Land cover comes from the USGS and EPA. Election-day and lead-up weather come from PRISM 4km daily grids and the NOAA Global Historical Climatology Network. Mail-voting and election-administration patterns come from the MIT Election Lab's Survey of the Performance of American Elections. Block-group crime detail comes from CrimeGrade. Internet data and modeling support provided by ISPreports.org.
Modeling and analysis by the BestNeighborhood data science team. Full methodology and findings: political spectrum map.
Methodology reviewed by the BestNeighborhood data team. Last updated May 2026.