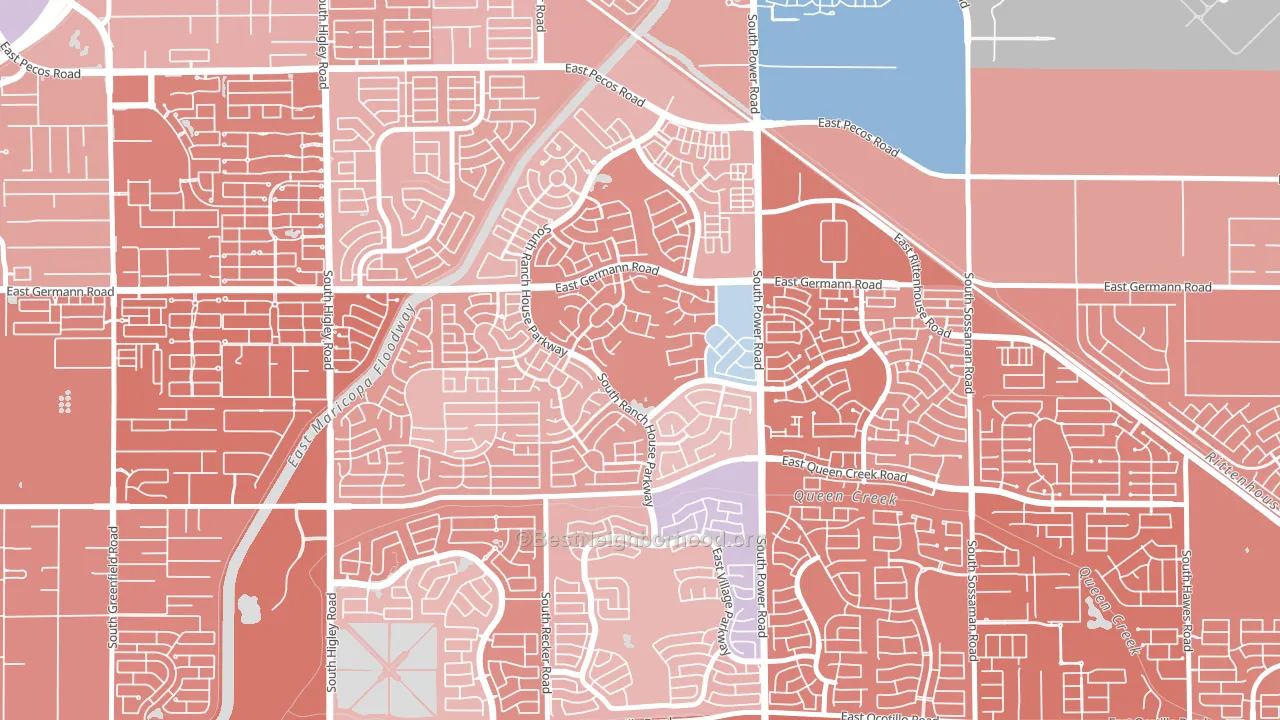
Power Ranch leans Republican by roughly 16 points: about 42% of voters vote Democratic and 58% Republican.
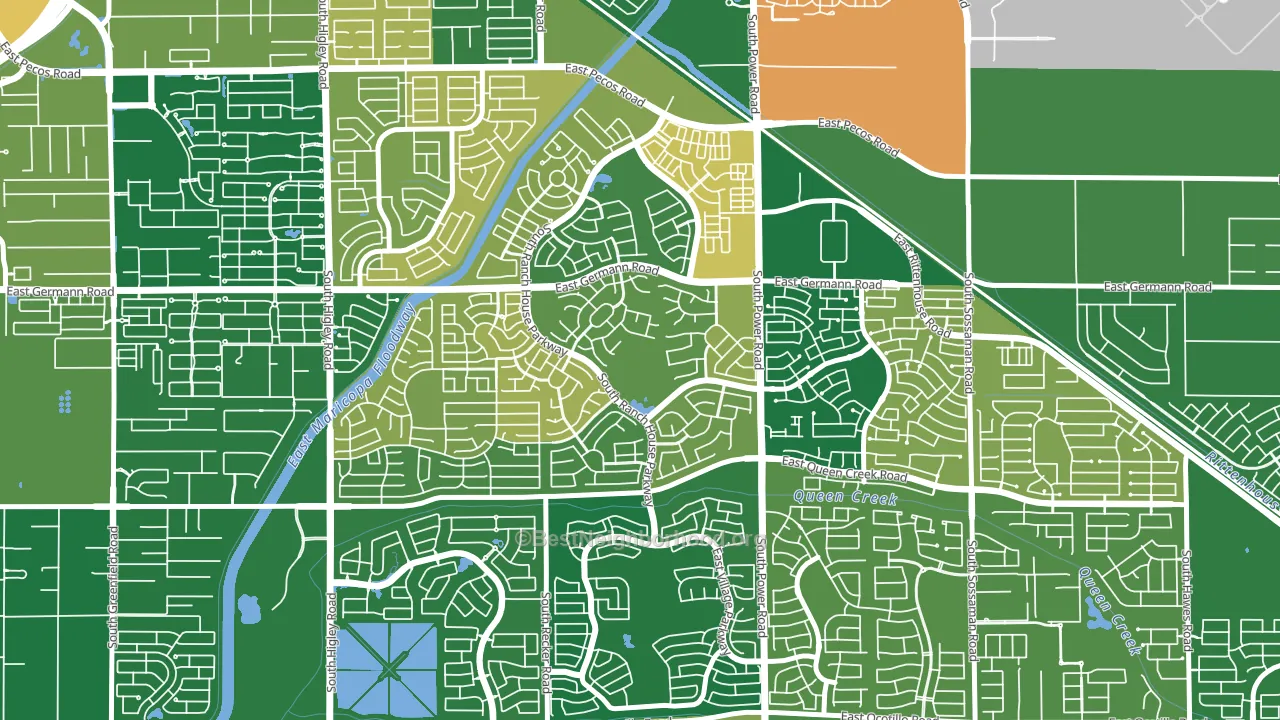
About 81% of adults in Power Ranch typically vote, above the U.S. average of about 62%. Among adults in Power Ranch, ~34% vote Democratic, ~47% Republican, and ~19% don't vote. The map below shows estimated turnout by block group.
How Power Ranch compares
Power Ranch runs about 11 points more Republican than Arizona as a whole.
Politics vary noticeably by block within Power Ranch. The west side is the most Republican-leaning (R+22) and the east side is the least Republican-leaning (R+11), a spread of about 11 points.
Why Power Ranch leans the way it does
This analysis examined 14,881 data points per neighborhood to find what predicts political lean and turnout. The items below are a few correlations that stood out for Power Ranch, not a ranked or complete list of what matters most.
Areas with many family households vote Republican. About 75% of households in Power Ranch are family households, about 8 points above the U.S. average of 67%.
Preventive-care access and voter turnout
Places with strong routine preventive-care access tend to turn out at a higher rate; Power Ranch, Gilbert, AZ sits above the national average on this measure. Dental visits do not drive turnout; the rate reflects income, insurance, and healthcare access, which line up with who votes.
Why turnout in Power Ranch looks the way it does
Areas with high high-school completion turn out at higher rates. About 99% of adults in Power Ranch have completed high school, about 12 points above the Arizona average of 87%. Learn more about the findings and methodology on the political spectrum map.
Nearby Neighborhoods
- San Tan Ranch, Gilbert, AZ R+16
- Sun Groves, Chandler, AZ R+8
- Southeast Mesa, Mesa, AZ R+18
- The Islands, Gilbert, AZ R+5
- Heritage District, Gilbert, AZ D+5
- Pecan Creek, San Tan Valley, AZ R+23
- Downtown Chandler, Chandler, AZ D+22
- Circle Cross Ranch, San Tan Valley, AZ R+22
- Clemente Ranch, Chandler, AZ Even
- Castlegate, San Tan Valley, AZ R+32
Neighborhoods with Similar Populations
- Shadyside, Pittsburgh, PA D+68
- West Oak Hill, Austin, TX D+24
- Hartranft, Philadelphia, PA D+77
- Tuttle West, Dublin, OH D+14
- Glen Eden, Hayward, CA D+33
- Spring Hill, Somerville, MA D+75
- Album Park, El Paso, TX D+19
- Evergreen, Detroit, MI D+87
- John Barrow, Little Rock, AR D+65
- Canton, Baltimore, MD D+58
Sources and methodology
Precinct-level voting records used to fit the model come from Arizona Secretary of State, Elections, distributed by the Voting and Election Science Team. Demographic inputs come from the U.S. Census Bureau (ACS 5-year estimates and the 2020 Decennial Census). Health and environmental inputs come from the CDC (PLACES and the Environmental Justice Index). Land cover comes from the USGS and EPA. Election-day and lead-up weather come from PRISM 4km daily grids and the NOAA Global Historical Climatology Network. Mail-voting and election-administration patterns come from the MIT Election Lab's Survey of the Performance of American Elections. Block-group crime detail comes from CrimeGrade. Internet data and modeling support provided by ISPreports.org.
Modeling and analysis by the BestNeighborhood data science team. Full methodology and findings: political spectrum map.
Methodology reviewed by the BestNeighborhood data team. Last updated May 2026.