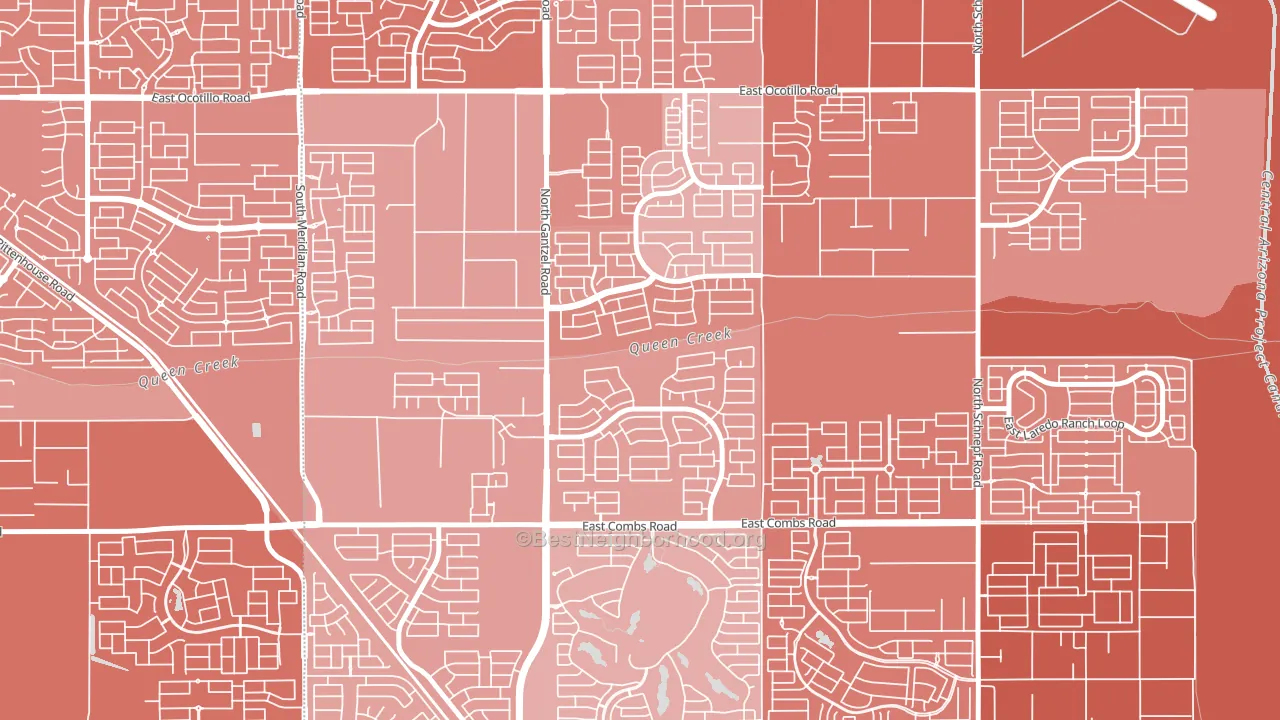
Pecan Creek leans Republican by roughly 24 points: about 38% of voters vote Democratic and 62% Republican.
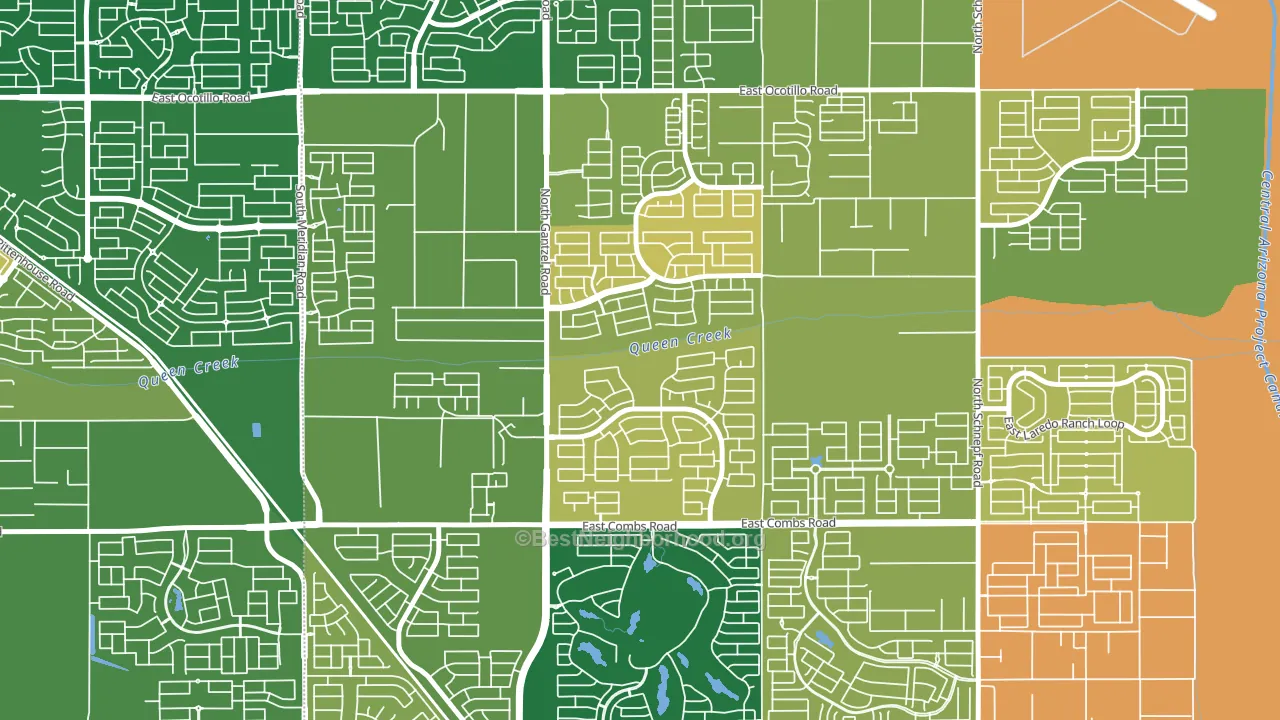
About 64% of adults in Pecan Creek typically vote, near the U.S. average of about 62%. Among adults in Pecan Creek, ~24% vote Democratic, ~39% Republican, and ~37% don't vote. The map below shows estimated turnout by block group.
How Pecan Creek compares
Pecan Creek sits in a sparsely populated area with few comparable neighborhoods nearby.
Pecan Creek runs about 18 points more Republican than Arizona as a whole.
Why Pecan Creek leans the way it does
This analysis examined 14,881 data points per neighborhood to find what predicts political lean and turnout. The items below are a few correlations that stood out for Pecan Creek, not a ranked or complete list of what matters most.
Areas with many family households vote Republican. About 86% of households in Pecan Creek are family households, about 19 points above the U.S. average of 67%.
Population density and Democratic lean
Places with high population density tend to lean Democratic; Pecan Creek, San Tan Valley, AZ sits in the top quarter nationally on this measure.
Why turnout in Pecan Creek looks the way it does
Turnout in Pecan Creek sits close to the national pattern. Routine healthcare access, homeownership, education, and food security all land near their national averages here. Learn more about the findings and methodology on the political spectrum map.
Nearby Neighborhoods
- Castlegate, San Tan Valley, AZ R+32
- Circle Cross Ranch, San Tan Valley, AZ R+22
- Power Ranch, Gilbert, AZ R+16
- San Tan Ranch, Gilbert, AZ R+16
- Palm Springs, Apache Junction, AZ R+23
- Southeast Mesa, Mesa, AZ R+18
- Sun Groves, Chandler, AZ R+8
- Heritage District, Gilbert, AZ D+5
- Northeast, Mesa, AZ R+20
- The Islands, Gilbert, AZ R+5
Neighborhoods with Similar Populations
- Greater South Side, Des Moines, IA D+12
- Upper B Street, Hayward, CA D+45
- South Collinwood, Cleveland, OH D+83
- Dietz, Tucson, AZ D+11
- Tatnuck, Worcester, MA D+32
- Saddle Rock Golf Club, Aurora, CO D+10
- Mid City-Santa Ana, Santa Ana, CA D+33
- Plymouth Colony, Atlanta, GA D+45
- Northwest, Kansas City, KS D+64
- Pembroke Falls, Pembroke Pines, FL D+11
Sources and methodology
Precinct-level voting records used to fit the model come from Arizona Secretary of State, Elections, distributed by the Voting and Election Science Team. Demographic inputs come from the U.S. Census Bureau (ACS 5-year estimates and the 2020 Decennial Census). Health and environmental inputs come from the CDC (PLACES and the Environmental Justice Index). Land cover comes from the USGS and EPA. Election-day and lead-up weather come from PRISM 4km daily grids and the NOAA Global Historical Climatology Network. Mail-voting and election-administration patterns come from the MIT Election Lab's Survey of the Performance of American Elections. Block-group crime detail comes from CrimeGrade. Internet data and modeling support provided by ISPreports.org.
Modeling and analysis by the BestNeighborhood data science team. Full methodology and findings: political spectrum map.
Methodology reviewed by the BestNeighborhood data team. Last updated May 2026.