Tucker County is a Republican stronghold. About 25% of voters here vote Democratic and 75% Republican.
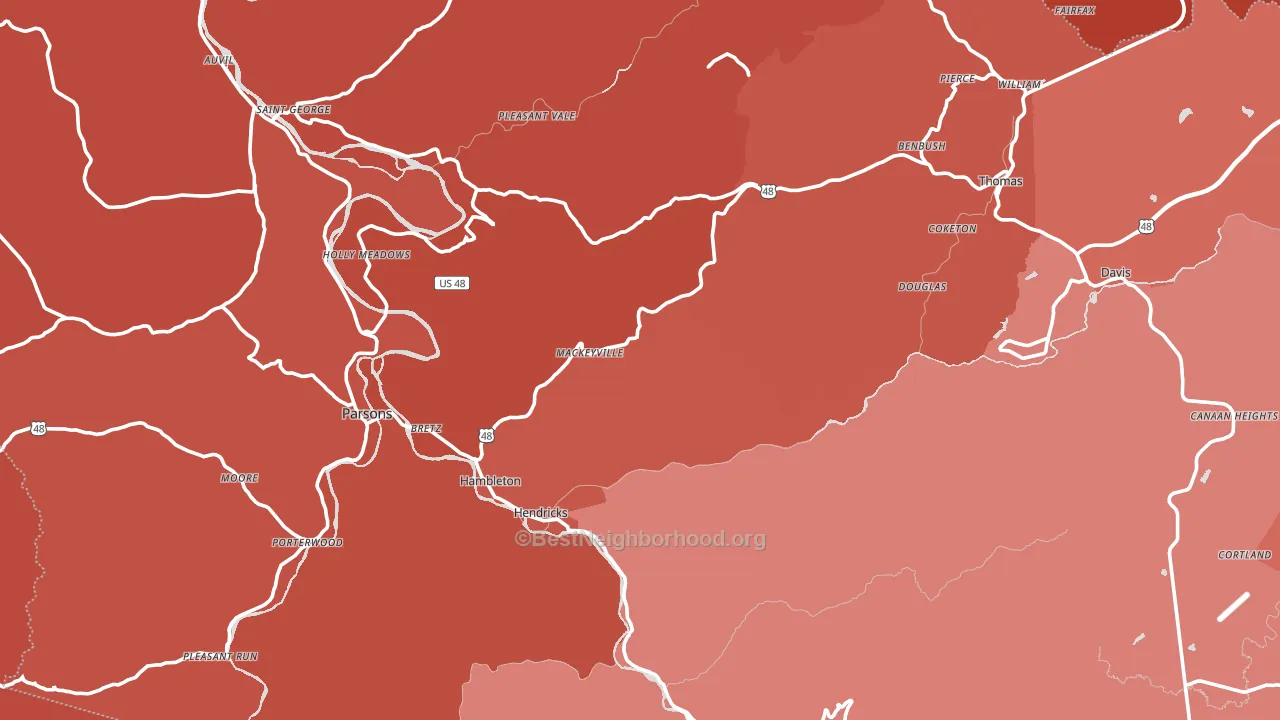
About 63% of adults in Tucker County typically vote, near the U.S. average of about 62%. Among adults in Tucker County, ~16% vote Democratic, ~48% Republican, and ~36% don't vote. The map below shows estimated turnout by block group.
How Tucker County compares
Among counties within 50 miles, Tucker County leans more Republican than 3 of 14 neighbors.
Tucker County runs about 8 points more Republican than West Virginia as a whole.
Politics vary noticeably by city within Tucker County. The southwest side is the most Republican-leaning (R+62) and the east side is the least Republican-leaning (R+25), a spread of about 37 points.
Why Tucker County leans the way it does
This analysis examined 14,881 data points per county to find what predicts political lean and turnout. The items below are a few correlations that stood out for Tucker County, not a ranked or complete list of what matters most.
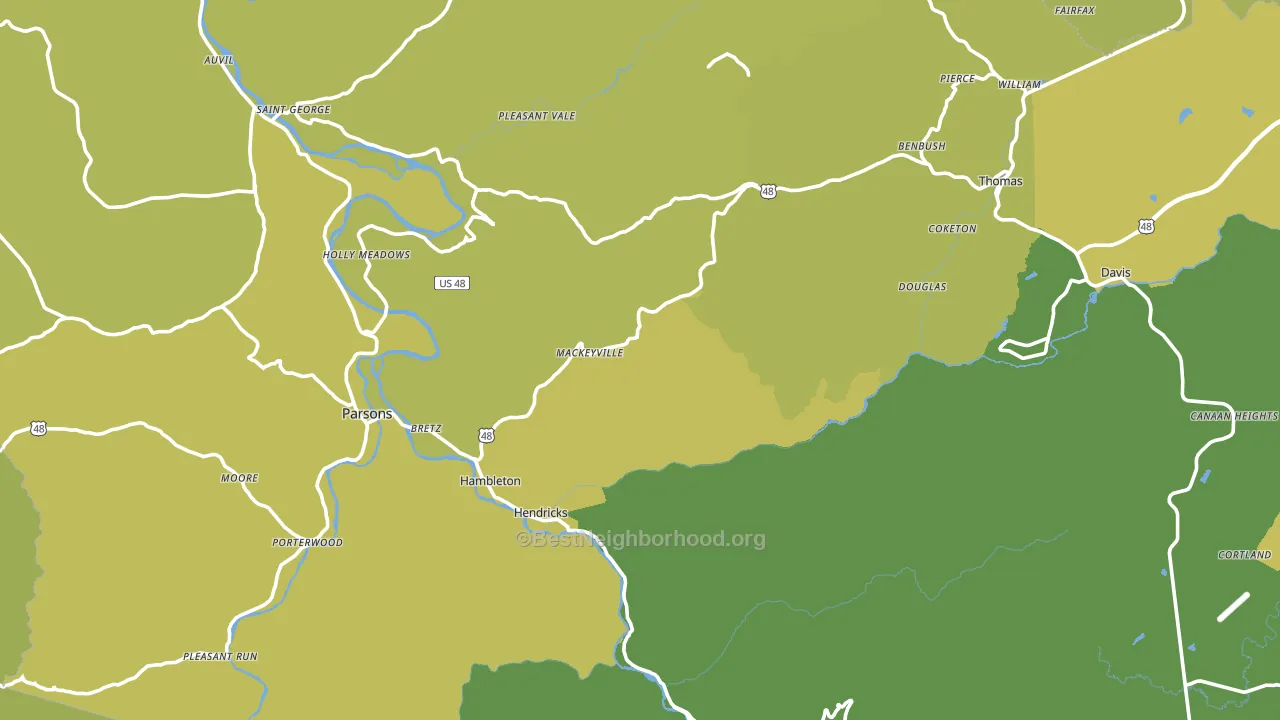
Rural areas vote Republican. About 4% of residents in Tucker County live in densely developed areas, about 8 points below the West Virginia average of 12%.
Developed land and Republican lean
Places with a rural land-use pattern tend to lean Republican; Tucker County, WV sits in the bottom tenth nationally on this measure. Developed land does not change how people vote; it mostly reflects how urban a place is.
Why turnout in Tucker County looks the way it does
Areas with strong routine healthcare access turn out at higher rates. Tucker County is in the top quarter nationally for routine-care measures such as insurance coverage, preventive screenings, and dental visits. The dental-visit rate here is about 59%, below 56% of counties. Homeowners vote more often than renters, and about 81% of households in Tucker County own their home, above 82% of counties. Learn more about the findings and methodology on the political spectrum map.
Nearby Counties
- Barbour County, WV R+60
- Randolph County, WV R+51
- Grant County, WV R+74
- Preston County, WV R+58
- Taylor County, WV R+55
- Garrett County, MD R+50
- Pendleton County, WV R+61
- Upshur County, WV R+55
- Hardy County, WV R+61
- Marion County, WV R+37
Counties with Similar Populations
- Thurston County, NE D+23
- Charles City County, VA D+8
- Broadwater County, MT R+54
- Clinch County, GA R+51
- Refugio County, TX R+36
- Monroe County, AR R+33
- Burt County, NE R+55
- Galax City, VA R+38
- Lac qui Parle County, MN R+38
- Southeast Fairbanks Census Area, AK R+39
Sources and methodology
Precinct-level voting records used to fit the model come from West Virginia Secretary of State, Elections, distributed by the Voting and Election Science Team. Demographic inputs come from the U.S. Census Bureau (ACS 5-year estimates and the 2020 Decennial Census). Health and environmental inputs come from the CDC (PLACES and the Environmental Justice Index). Land cover comes from the USGS and EPA. Election-day and lead-up weather come from PRISM 4km daily grids and the NOAA Global Historical Climatology Network. Mail-voting and election-administration patterns come from the MIT Election Lab's Survey of the Performance of American Elections. Block-group crime detail comes from CrimeGrade. Internet data and modeling support provided by ISPreports.org.
Modeling and analysis by the BestNeighborhood data science team. Full methodology and findings: political spectrum map.
Methodology reviewed by the BestNeighborhood data team. Last updated May 2026.