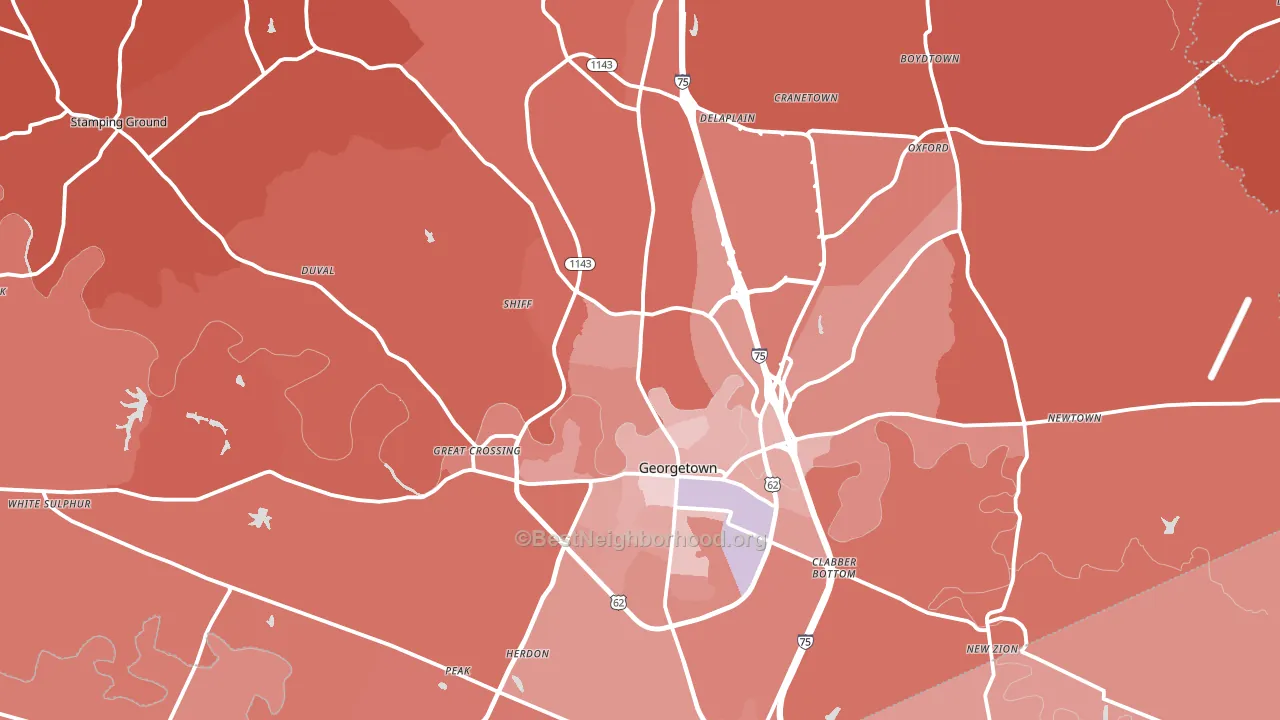
Scott County leans Republican by roughly 30 points: about 35% of voters vote Democratic and 65% Republican.
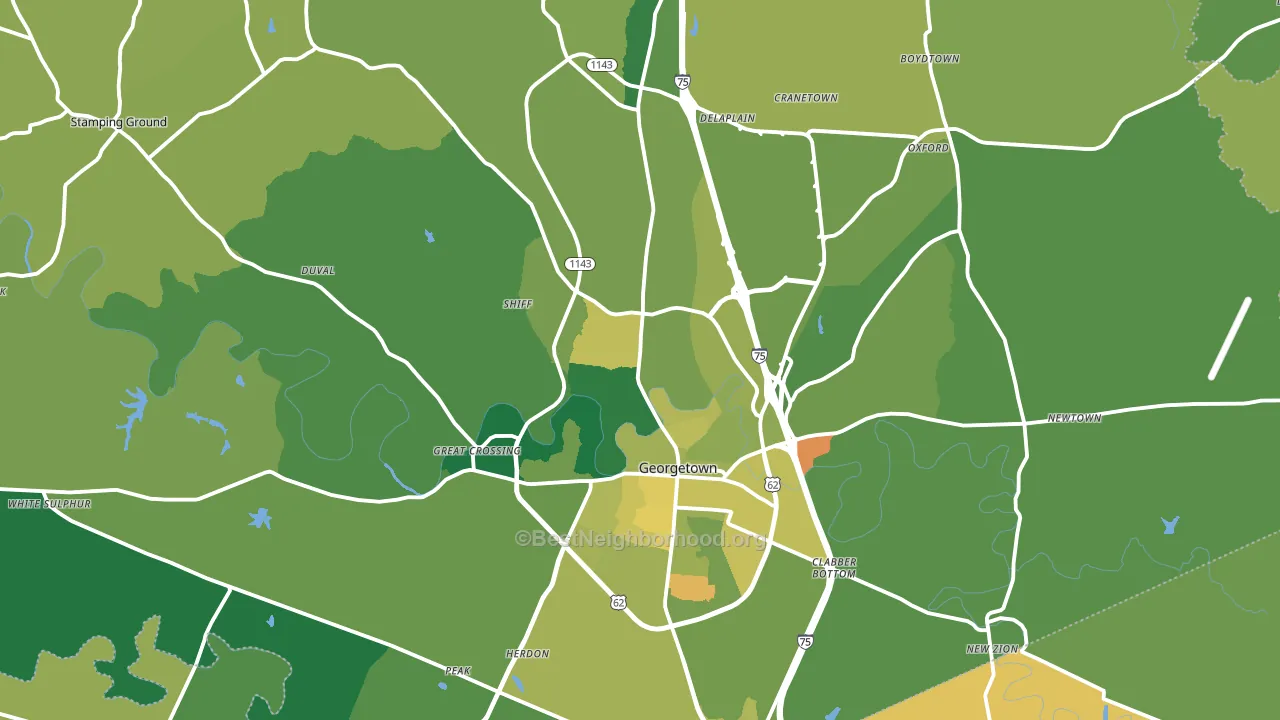
About 74% of adults in Scott County typically vote, above the U.S. average of about 62%. Among adults in Scott County, ~26% vote Democratic, ~48% Republican, and ~26% don't vote. The map below shows estimated turnout by block group.
How Scott County compares
Among counties within 50 miles, Scott County leans more Republican than 6 of 33 neighbors.
Politically, Scott County sits close to the rest of Kentucky.
Politics vary noticeably by city within Scott County. The northwest side is the most Republican-leaning (R+52) and the south side is the least Republican-leaning (R+16), a spread of about 36 points.
Why Scott County leans the way it does
This analysis examined 14,881 data points per county to find what predicts political lean and turnout. The items below are a few correlations that stood out for Scott County, not a ranked or complete list of what matters most.
Scott County votes Republican even though it is densely developed (about 50%, far above the Kentucky average of 18%). State and regional patterns outweigh the Democratic lean that density usually predicts here. A high family-household share predicts Republican voting, and about 70% of households in Scott County are family households, above 81% of counties.
Park access and Republican lean
Places with low park coverage tend to lean Republican; Scott County, KY sits below the national average on this measure. Park access does not change how people vote; it tends to track denser, higher-income areas.
Why turnout in Scott County looks the way it does
Areas with high high-school completion turn out at higher rates. About 94% of adults in Scott County have completed high school, about 9 points above the Kentucky average of 85%. Learn more about the findings and methodology on the political spectrum map.
Nearby Counties
- Fayette County, KY D+24
- Woodford County, KY R+29
- Franklin County, KY R+19
- Bourbon County, KY R+37
- Harrison County, KY R+51
- Jessamine County, KY R+35
- Anderson County, KY R+50
- Owen County, KY R+63
- Clark County, KY R+39
- Nicholas County, KY R+60
Counties with Similar Populations
- Colbert County, AL R+46
- Iron County, UT R+53
- Vermilion Parish, LA R+55
- Putnam County, WV R+46
- Waller County, TX R+20
- Gordon County, GA R+60
- Acadia Parish, LA R+54
- Hawkins County, TN R+66
- Box Elder County, UT R+56
- Chisago County, MN R+29
Sources and methodology
Precinct-level voting records used to fit the model come from Kentucky State Board of Elections, distributed by the Voting and Election Science Team. Demographic inputs come from the U.S. Census Bureau (ACS 5-year estimates and the 2020 Decennial Census). Health and environmental inputs come from the CDC (PLACES and the Environmental Justice Index). Land cover comes from the USGS and EPA. Election-day and lead-up weather come from PRISM 4km daily grids and the NOAA Global Historical Climatology Network. Mail-voting and election-administration patterns come from the MIT Election Lab's Survey of the Performance of American Elections. Block-group crime detail comes from CrimeGrade. Internet data and modeling support provided by ISPreports.org.
Modeling and analysis by the BestNeighborhood data science team. Full methodology and findings: political spectrum map.
Methodology reviewed by the BestNeighborhood data team. Last updated May 2026.