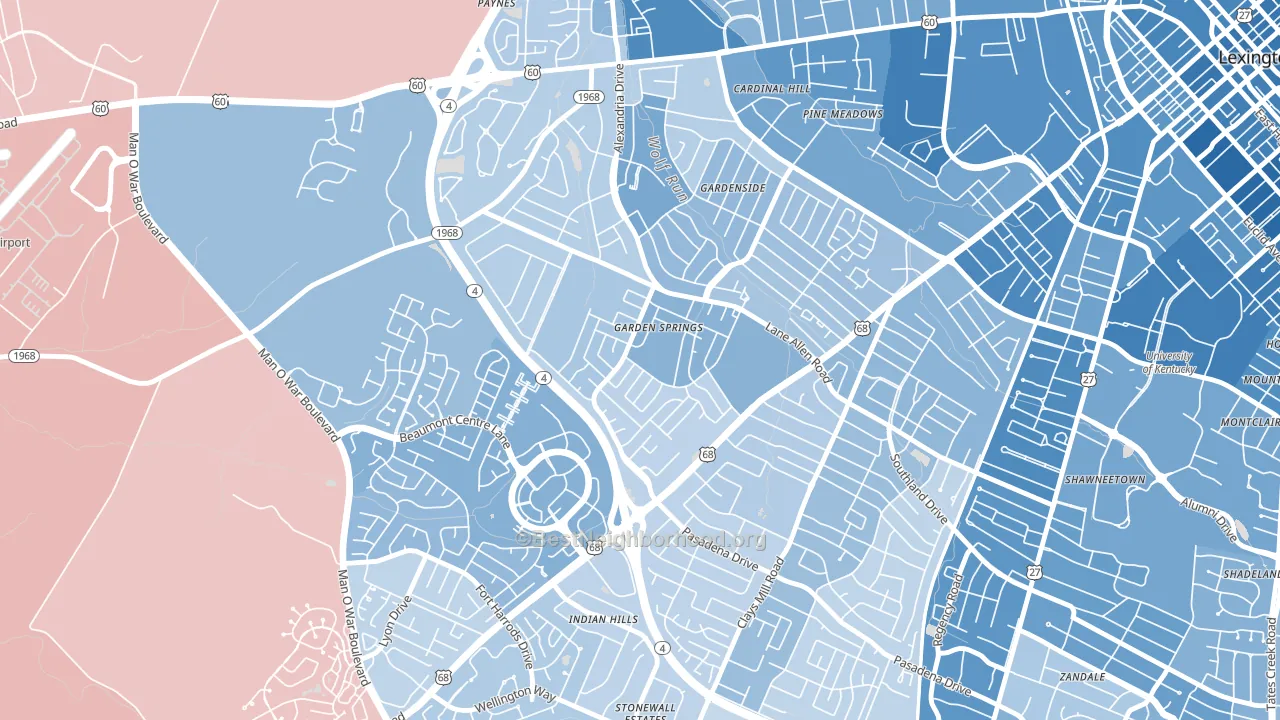
Garden Springs leans Democratic by roughly 24 points: about 62% of voters vote Democratic and 38% Republican.
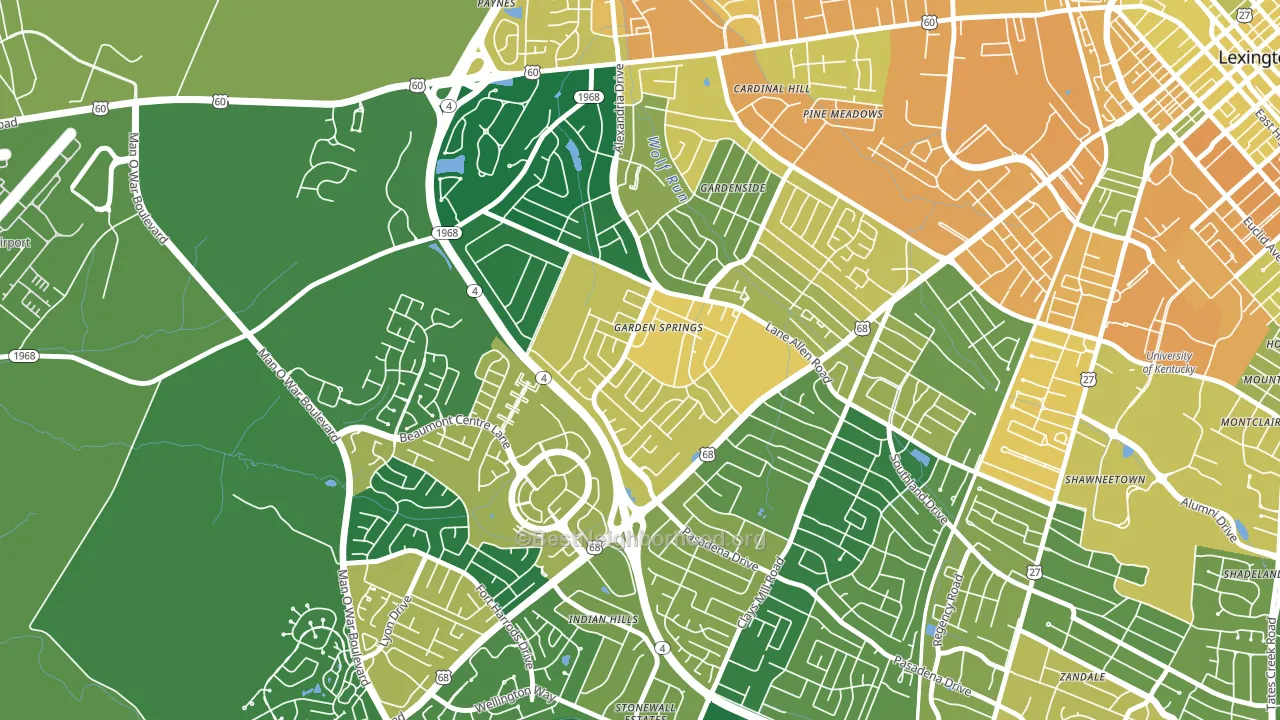
About 63% of adults in Garden Springs typically vote, near the U.S. average of about 62%. Among adults in Garden Springs, ~39% vote Democratic, ~24% Republican, and ~37% don't vote. The map below shows estimated turnout by block group.
How Garden Springs compares
Among neighborhoods within 5 miles, Garden Springs leans more Democratic than 4 of 16 neighbors.
Garden Springs runs about 54 points more Democratic than Kentucky as a whole. Kentucky leans Republican overall, while Garden Springs is one of the few Democratic-leaning pockets.
Why Garden Springs leans the way it does
This analysis examined 14,881 data points per neighborhood to find what predicts political lean and turnout. The items below are a few correlations that stood out for Garden Springs, not a ranked or complete list of what matters most.
Dense areas vote Democratic. More than 99% of residents in Garden Springs live in densely developed areas, about 64 points above the U.S. average of 36%. Garden Springs runs against the grain of Kentucky, a Democratic-leaning pocket in a Republican-leaning state.
Walkability and Democratic lean
Places with a highly walkable street grid tend to lean Democratic; Garden Springs, Lexington, KY sits above the national average on this measure. A walkable street grid does not change how people vote; it mostly reflects how urban a place is.
Why turnout in Garden Springs looks the way it does
Turnout in Garden Springs sits close to the national pattern. Routine healthcare access, homeownership, education, and food security all land near their national averages here. Learn more about the findings and methodology on the political spectrum map.
Nearby Neighborhoods
- Gardenside-Colony, Lexington, KY D+21
- Southland Deerfield Open Gates, Lexington, KY D+30
- Cardinal Hill-Pine Meadow, Lexington, KY D+40
- Holiday Hills, Lexington, KY D+25
- Virginia Ave, Lexington, KY D+41
- Indian Hills-Stonewall Estates-Monticello, Lexington, KY D+5
- University of Kentucky, Lexington, KY D+52
- Mount Vernon-Hollywood-Montclair, Lexington, KY D+54
- Brookhaven-Lansdowne, Lexington, KY D+25
- Downtown Lexington, Lexington, KY D+55
Neighborhoods with Similar Populations
- South East Hills, Erie, PA D+16
- Park East, Sarasota, FL D+13
- North Riverside, Wichita, KS D+10
- Farmers Market District, Dallas, TX D+51
- Kingsland, Lyndhurst, NJ R+8
- Riverside Park, Fort Lauderdale, FL D+34
- Falcon Trace, Southchase, FL D+10
- Sedgefield, Charlotte, NC D+27
- Corryville, Cincinnati, OH D+54
- Arctic, West Warwick, RI D+8
Sources and methodology
Precinct-level voting records used to fit the model come from Kentucky State Board of Elections, distributed by the Voting and Election Science Team. Demographic inputs come from the U.S. Census Bureau (ACS 5-year estimates and the 2020 Decennial Census). Health and environmental inputs come from the CDC (PLACES and the Environmental Justice Index). Land cover comes from the USGS and EPA. Election-day and lead-up weather come from PRISM 4km daily grids and the NOAA Global Historical Climatology Network. Mail-voting and election-administration patterns come from the MIT Election Lab's Survey of the Performance of American Elections. Block-group crime detail comes from CrimeGrade. Internet data and modeling support provided by ISPreports.org.
Modeling and analysis by the BestNeighborhood data science team. Full methodology and findings: political spectrum map.
Methodology reviewed by the BestNeighborhood data team. Last updated May 2026.