Douglas Park is a Democratic stronghold. About 77% of voters here vote Democratic and 23% Republican.
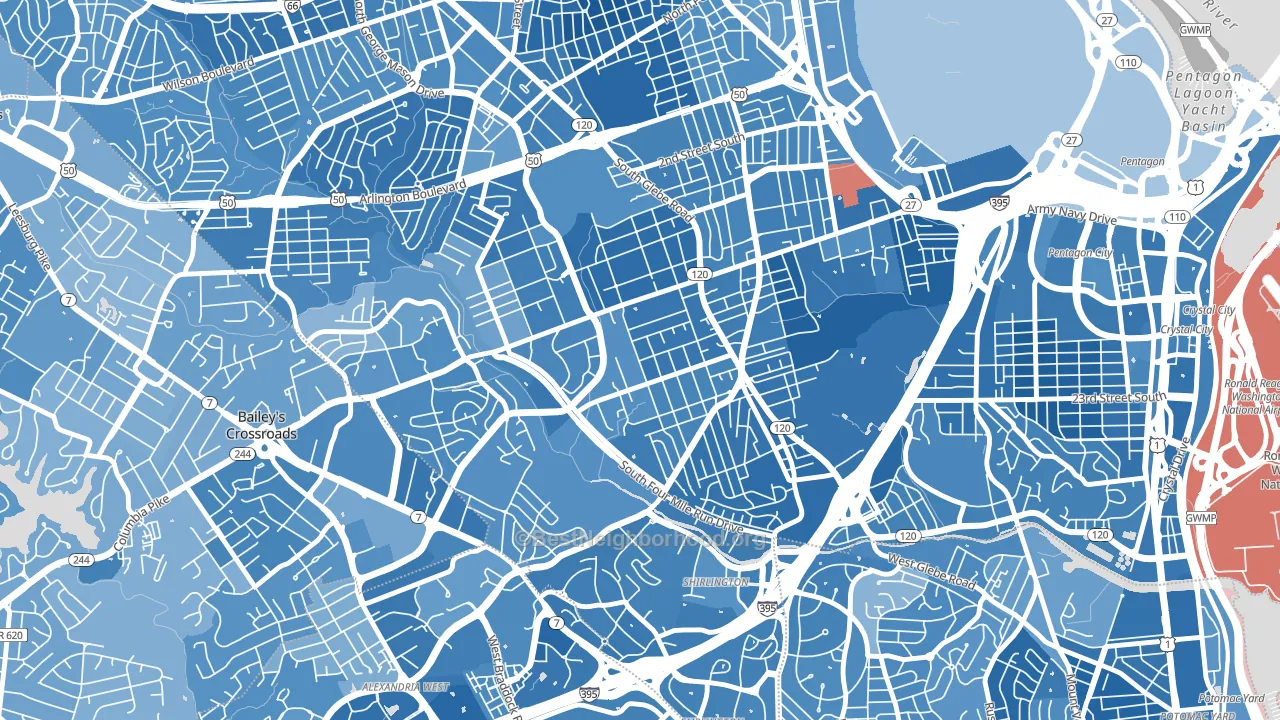
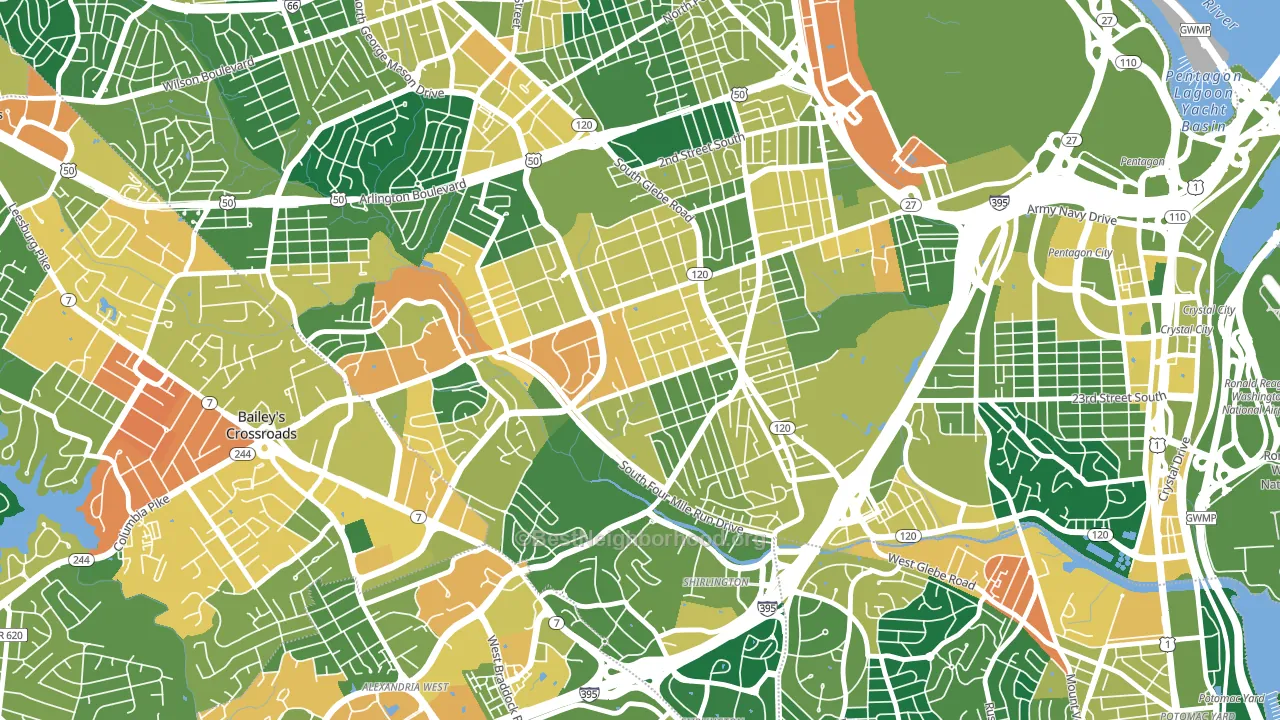
About 56% of adults in Douglas Park typically vote, below the U.S. average of about 62%. Among adults in Douglas Park, ~43% vote Democratic, ~13% Republican, and ~44% don't vote. The map below shows estimated turnout by block group.
How Douglas Park compares
Among neighborhoods within 5 miles, Douglas Park leans more Democratic than 16 of 50 neighbors.
Douglas Park runs about 47 points more Democratic than Virginia as a whole.
Politics vary noticeably by block within Douglas Park. The northeast side is the most Democratic-leaning (D+59) and the west side is the least Democratic-leaning (D+44), a spread of about 15 points.
Why Douglas Park leans the way it does
This analysis examined 14,881 data points per neighborhood to find what predicts political lean and turnout. The items below are a few correlations that stood out for Douglas Park, not a ranked or complete list of what matters most.
Dense areas vote Democratic. More than 99% of residents in Douglas Park live in densely developed areas, about 64 points above the U.S. average of 36%.
Park access and Democratic lean
Places with heavy park coverage tend to lean Democratic; Douglas Park, Arlington, VA sits in the top quarter nationally on this measure. Park access does not change how people vote; it tends to track denser, higher-income areas.
Why turnout in Douglas Park looks the way it does
Renters vote less often than owners. About 74% of households in Douglas Park rent, about 49 points above the U.S. average of 25%. Crowded housing lines up with lower turnout, and about 11% of homes in Douglas Park have more than one occupant per room, above 93% of neighborhoods. Learn more about the findings and methodology on the political spectrum map.
Nearby Neighborhoods
- Barcroft, Arlington, VA D+48
- Nauck, Arlington, VA D+67
- Columbia Forest, Arlington, VA D+51
- Columbia Heghts, Arlington, VA D+61
- Columbia Heights West, Arlington, VA D+40
- Penrose, Arlington, VA D+58
- Forest Glen, Arlington, VA D+43
- Fairlington-Shirlington, Arlington, VA D+64
- Long Branch Creek, Arlington, VA D+59
- Buckingham, Arlington, VA D+52
Neighborhoods with Similar Populations
- Sans Pareil, Jacksonville, FL R+3
- Hillside, Daly City, CA D+39
- Shenandoah, Aurora, CO D+23
- Trumbull Village, Albuquerque, NM D+23
- Brookside, Stockton, CA D+12
- Brentwood, Austin, TX D+59
- Providence Plantation, Charlotte, NC Even
- Balboa Park, San Diego, CA D+58
- Green Lake, Seattle, WA D+76
- Mount Tabor, Portland, OR D+85
Sources and methodology
Precinct-level voting records used to fit the model come from Virginia Department of Elections, distributed by the Voting and Election Science Team. Demographic inputs come from the U.S. Census Bureau (ACS 5-year estimates and the 2020 Decennial Census). Health and environmental inputs come from the CDC (PLACES and the Environmental Justice Index). Land cover comes from the USGS and EPA. Election-day and lead-up weather come from PRISM 4km daily grids and the NOAA Global Historical Climatology Network. Mail-voting and election-administration patterns come from the MIT Election Lab's Survey of the Performance of American Elections. Block-group crime detail comes from CrimeGrade. Internet data and modeling support provided by ISPreports.org.
Modeling and analysis by the BestNeighborhood data science team. Full methodology and findings: political spectrum map.
Methodology reviewed by the BestNeighborhood data team. Last updated May 2026.