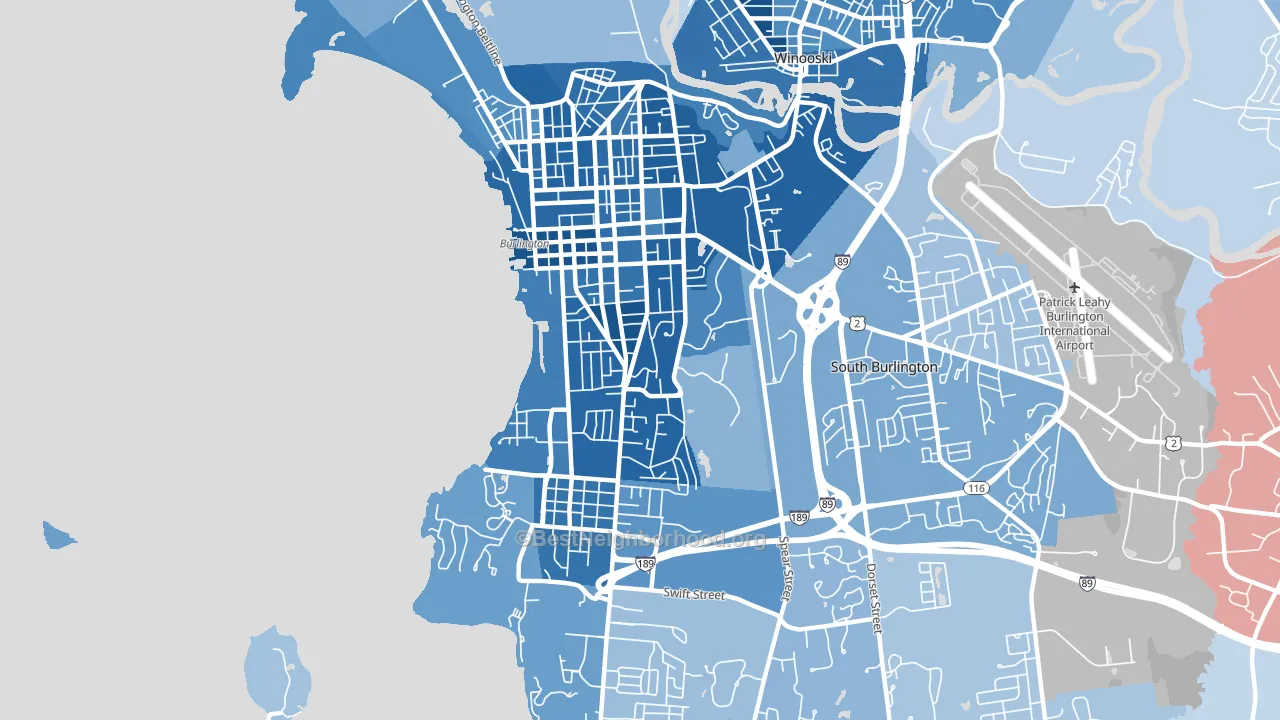
South End is a Democratic stronghold. About 84% of voters here vote Democratic and 16% Republican. These figures are model estimates: Vermont did not have precinct-level voting records available for training, so the numbers above come from demographic and health features rather than local ground truth.
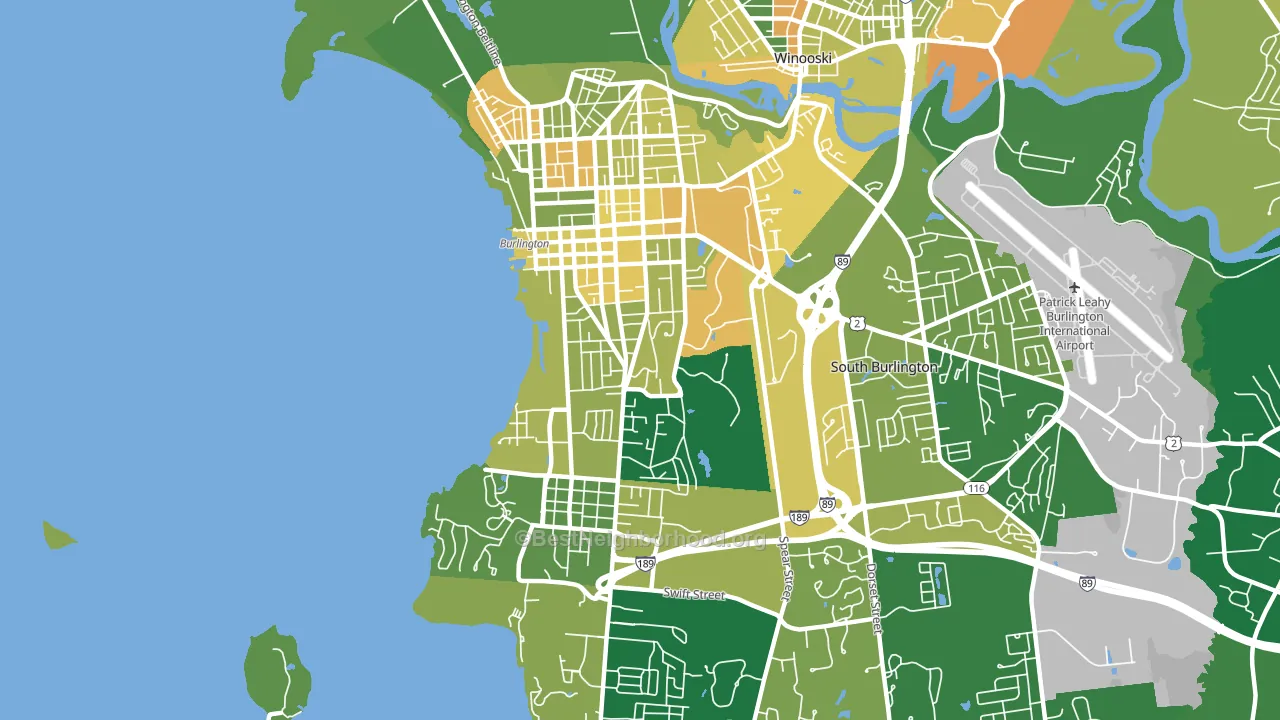
About 56% of adults in South End typically vote, below the U.S. average of about 62%. Among adults in South End, ~47% vote Democratic, ~9% Republican, and ~44% don't vote. The map below shows estimated turnout by block group.
How South End compares
Among neighborhoods within 5 miles, South End leans more Democratic than 3 of 4 neighbors.
South End runs about 36 points more Democratic than Vermont as a whole.
Politics vary noticeably by block within South End. The north side is the most Democratic-leaning (D+77) and the southeast side is the least Democratic-leaning (D+57), a spread of about 20 points.
Why South End leans the way it does
This analysis examined 14,881 data points per neighborhood to find what predicts political lean and turnout. The items below are a few correlations that stood out for South End, not a ranked or complete list of what matters most.
Areas with high college attainment vote Democratic. About 73% of adults in South End hold a bachelor's degree, about 44 points above the U.S. average of 28%. A high never-married share predicts Democratic voting, and about 67% of adults in South End have never been married, above 97% of neighborhoods.
Walkability and Democratic lean
Places with a highly walkable street grid tend to lean Democratic; South End, Burlington, VT sits in the top quarter nationally on this measure. A walkable street grid does not change how people vote; it mostly reflects how urban a place is.
Why turnout in South End looks the way it does
Renters vote less often than owners. About 65% of households in South End rent, about 40 points above the U.S. average of 25%. Learn more about the findings and methodology on the political spectrum map.
Nearby Neighborhoods
- Old North End, Burlington, VT D+72
- Centennial, Burlington, VT D+68
- South Burlington North, South Burlington, VT D+36
- New North End, Burlington, VT D+47
- Williston North, Williston, VT D+25
- Malletts Bay, Colchester, VT D+8
- Lower Village District, Claremont, NH R+13
- Franklin Falls, Franklin, NH R+4
- Vale and Eastern Avenue, Schenectady, NY D+42
- West End, Concord, NH D+48
Neighborhoods with Similar Populations
- Darlington, Pawtucket, RI D+22
- East Oak Hill, Austin, TX D+41
- Atwater Village, Los Angeles, CA D+53
- Hyannis, Barnstable Town, MA D+18
- East Cambridge, Cambridge, MA D+65
- Otay Mesa West, San Diego, CA D+20
- South Lake Union, Seattle, WA D+57
- Gold Coast, Alameda, CA D+64
- Nevin, Los Angeles, CA D+45
- Hollywood Riviera, Redondo Beach, CA D+25
Sources and methodology
Precinct-level voting records used to fit the model come from Vermont Secretary of State, Elections Division, distributed by the Voting and Election Science Team. Demographic inputs come from the U.S. Census Bureau (ACS 5-year estimates and the 2020 Decennial Census). Health and environmental inputs come from the CDC (PLACES and the Environmental Justice Index). Land cover comes from the USGS and EPA. Election-day and lead-up weather come from PRISM 4km daily grids and the NOAA Global Historical Climatology Network. Mail-voting and election-administration patterns come from the MIT Election Lab's Survey of the Performance of American Elections. Block-group crime detail comes from CrimeGrade. Internet data and modeling support provided by ISPreports.org.
Modeling and analysis by the BestNeighborhood data science team. VT did not have precinct-level voting records available for training, so the figures here come from extrapolation across demographic, health, and land-use features rather than local ground truth. Full methodology and findings: political spectrum map.
Methodology reviewed by the BestNeighborhood data team. Last updated May 2026.