Las Palmas leans heavily Democratic by roughly 34 points: about 67% of voters vote Democratic and 33% Republican.
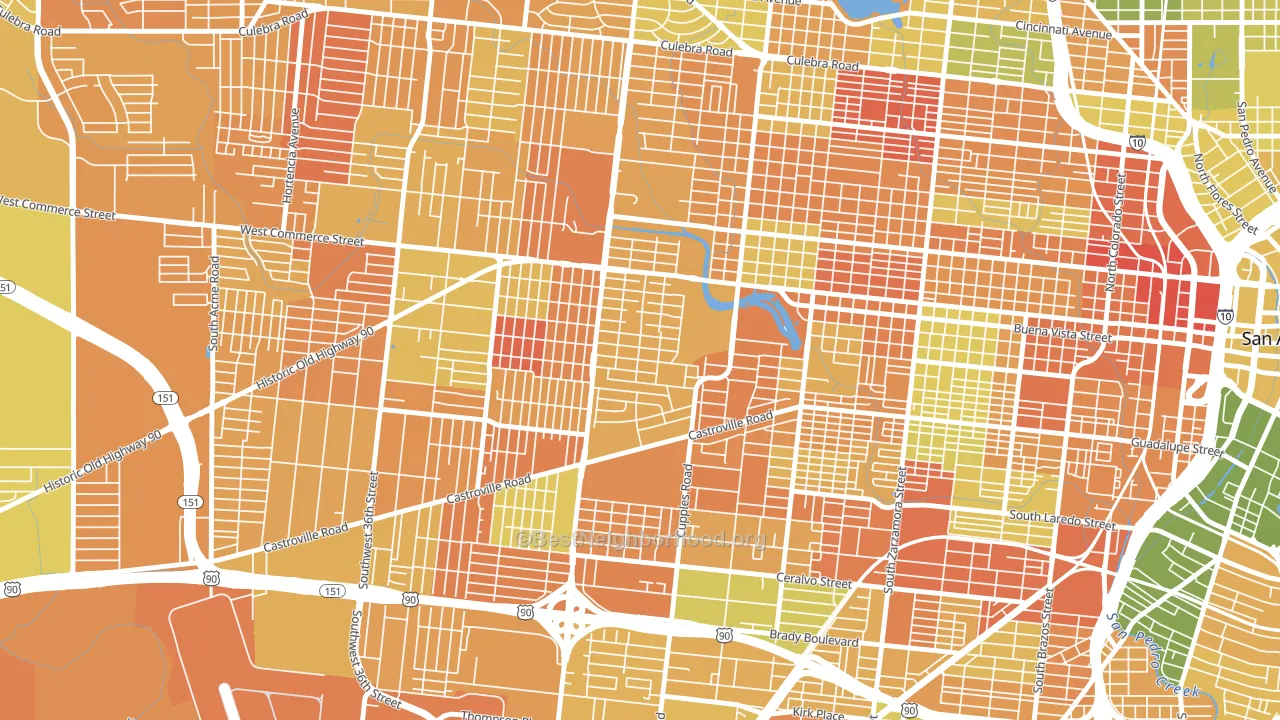
About 34% of adults in Las Palmas typically vote, below the U.S. average of about 62%. Among adults in Las Palmas, ~23% vote Democratic, ~11% Republican, and ~66% don't vote. The map below shows estimated turnout by block group.
How Las Palmas compares
Among neighborhoods within 5 miles, Las Palmas leans more Democratic than 19 of 36 neighbors.
Las Palmas runs about 49 points more Democratic than Texas as a whole. Texas leans Republican overall, while Las Palmas is one of the few Democratic-leaning pockets.
Why Las Palmas leans the way it does
This analysis examined 14,881 data points per neighborhood to find what predicts political lean and turnout. The items below are a few correlations that stood out for Las Palmas, not a ranked or complete list of what matters most.
Las Palmas votes against the grain of Texas. Texas leans Republican overall, while Las Palmas runs about 49 points more Democratic.
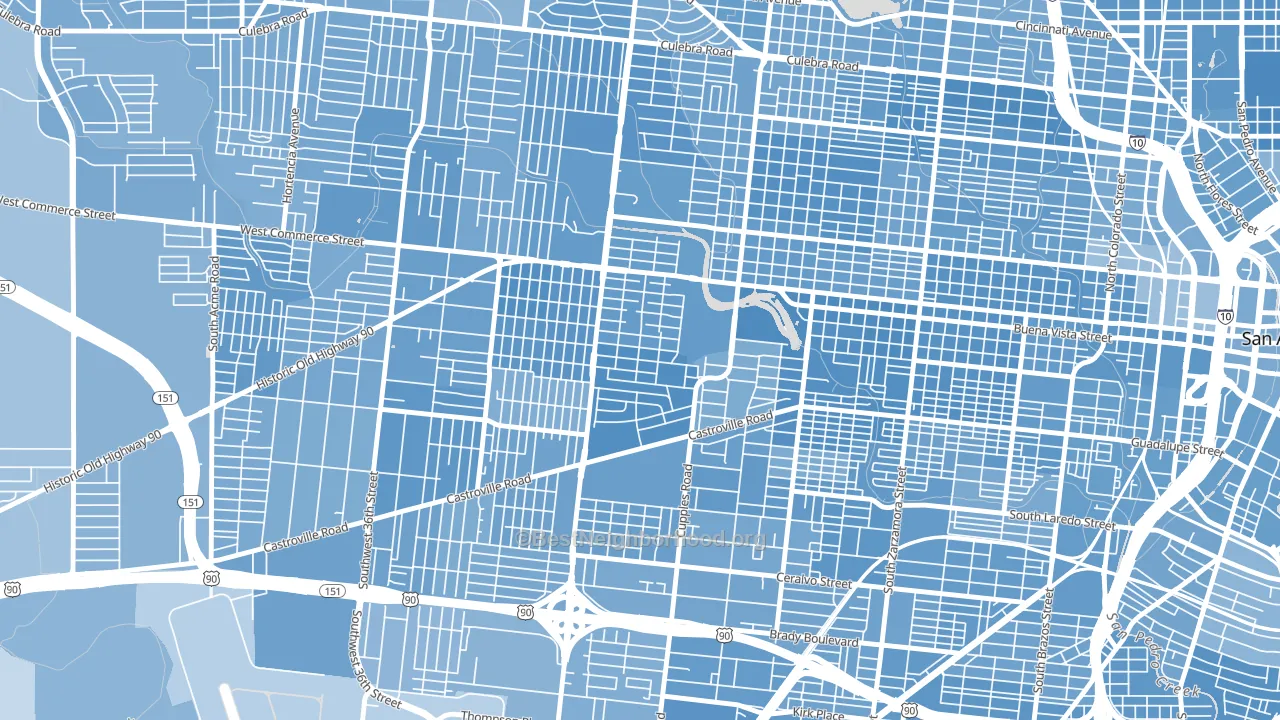
Walkability and Democratic lean
Places with a highly walkable street grid tend to lean Democratic; Las Palmas, San Antonio, TX sits in the top tenth nationally on this measure. A walkable street grid does not change how people vote; it mostly reflects how urban a place is.
Why turnout in Las Palmas looks the way it does
Areas with limited routine healthcare access turn out at lower rates. Las Palmas is in the bottom quarter nationally for routine-care measures such as insurance coverage, preventive screenings, and dental visits. The dental-visit rate here is about 38%, about 15 points below the Texas average of 54%. Low high-school completion lines up with lower turnout, and about 62% of adults in Las Palmas have completed high school, below 98% of neighborhoods. High-crime urban areas turn out at lower rates, and Las Palmas sits in the top 15% on a violent-crime measure. Learn more about the findings and methodology on the political spectrum map.
Nearby Neighborhoods
- Greater Gardendale, San Antonio, TX D+29
- Prospect Hill, San Antonio, TX D+39
- Los Jardines, San Antonio, TX D+32
- Memorial Heights, San Antonio, TX D+35
- Brady Gardens, San Antonio, TX D+34
- Thompson Community, San Antonio, TX D+33
- Avenida Guadalupe, San Antonio, TX D+37
- Community Workers Council, San Antonio, TX D+27
- Woodlawn Lake, San Antonio, TX D+37
- Loma Park, San Antonio, TX D+27
Neighborhoods with Similar Populations
- Sun Willows, Pasco, WA D+13
- Downtown Bradenton, Bradenton, FL D+22
- Melrose-Rugby, Roanoke, VA D+81
- Eastside, Binghamton, NY D+15
- East Meyer, Kansas City, MO D+80
- Canterbury Green, Fort Wayne, IN D+21
- Boca Teeca, Boca Raton, FL Even
- Wasatch Hollow, Salt Lake City, UT D+67
- West Osbornsville, Brick, NJ R+32
- Confederate Point, Jacksonville, FL D+20
Sources and methodology
Precinct-level voting records used to fit the model come from Texas Secretary of State, Elections Division, distributed by the Voting and Election Science Team. Demographic inputs come from the U.S. Census Bureau (ACS 5-year estimates and the 2020 Decennial Census). Health and environmental inputs come from the CDC (PLACES and the Environmental Justice Index). Land cover comes from the USGS and EPA. Election-day and lead-up weather come from PRISM 4km daily grids and the NOAA Global Historical Climatology Network. Mail-voting and election-administration patterns come from the MIT Election Lab's Survey of the Performance of American Elections. Block-group crime detail comes from CrimeGrade. Internet data and modeling support provided by ISPreports.org.
Modeling and analysis by the BestNeighborhood data science team. Full methodology and findings: political spectrum map.
Methodology reviewed by the BestNeighborhood data team. Last updated May 2026.