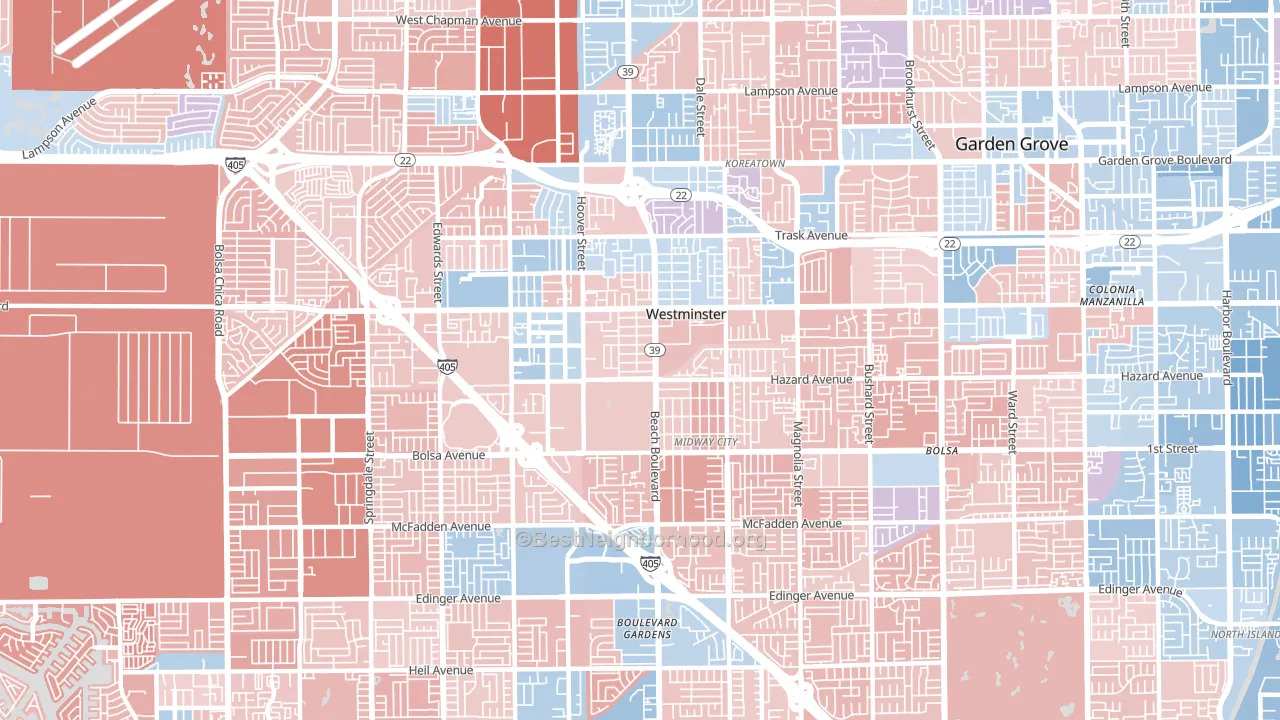
Westminster is a true toss-up. About 48% of voters here vote Democratic and 52% Republican.
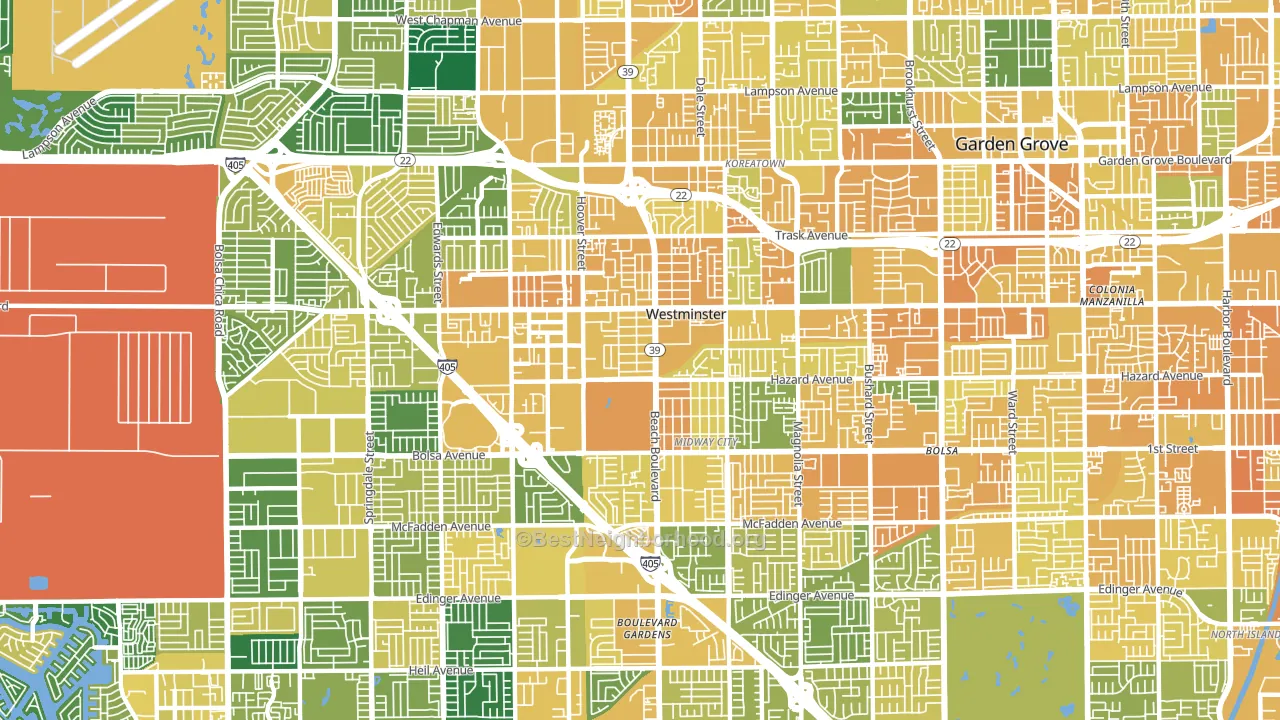
About 51% of adults in Westminster typically vote, below the U.S. average of about 62%. Among adults in Westminster, ~25% vote Democratic, ~27% Republican, and ~48% don't vote. The map below shows estimated turnout by block group.
How Westminster compares
Among cities within 25 miles, Westminster leans more Republican than 107 of 119 neighbors.
Westminster runs about 25 points more Republican than California as a whole. California leans Democratic overall, while Westminster is one of the few Republican-leaning pockets.
Why Westminster leans the way it does
This analysis examined 14,881 data points per city to find what predicts political lean and turnout. The items below are a few correlations that stood out for Westminster, not a ranked or complete list of what matters most.
Westminster votes against the grain of California. California leans Democratic overall, while Westminster runs about 25 points more Republican.
Cancer-screening access and voter turnout
Places with low colon-cancer-screening access tend to turn out at a lower rate; Westminster, CA sits in the bottom tenth nationally on this measure. Cancer screening does not drive turnout; it reflects income, insurance, and healthcare access.
Why turnout in Westminster looks the way it does
Renters vote less often than owners. About 45% of households in Westminster rent, about 20 points above the U.S. average of 25%. High food insecurity lines up with lower turnout, and about 23% of adults in Westminster report food insecurity, above 87% of cities. Learn more about the findings and methodology on the political spectrum map.
Nearby Cities
- Midway City, CA R+8
- Garden Grove, CA Even
- Stanton, CA D+6
- Fountain Valley, CA R+3
- Huntington Beach, CA R+4
- Sunset Beach, CA R+15
- Los Alamitos, CA Even
- Cypress, CA D+3
- Seal Beach, CA D+4
- Rossmoor, CA Even
Cities with Similar Populations
- Auburn, WA D+18
- Valdosta, GA D+10
- Missoula, MT D+25
- Fishers, IN D+2
- Redwood City, CA D+53
- Gulfport, MS Even
- South Gate, CA D+36
- Williamsburg, VA D+16
- San Tan Valley, AZ R+24
- Bremerton, WA D+17
Sources and methodology
Precinct-level voting records used to fit the model come from California Secretary of State, Elections, distributed by the Voting and Election Science Team. Demographic inputs come from the U.S. Census Bureau (ACS 5-year estimates and the 2020 Decennial Census). Health and environmental inputs come from the CDC (PLACES and the Environmental Justice Index). Land cover comes from the USGS and EPA. Election-day and lead-up weather come from PRISM 4km daily grids and the NOAA Global Historical Climatology Network. Mail-voting and election-administration patterns come from the MIT Election Lab's Survey of the Performance of American Elections. Block-group crime detail comes from CrimeGrade. Internet data and modeling support provided by ISPreports.org.
Modeling and analysis by the BestNeighborhood data science team. Full methodology and findings: political spectrum map.
Methodology reviewed by the BestNeighborhood data team. Last updated May 2026.