
Joshua, FL Flood Map
BestNeighborhood estimates that 3.7% of residents in Joshua, about 1 in 27, live in a FEMA high-risk flood zone, compared with 24% in Florida and 5.6% nationwide.
These figures come from BestNeighborhood's flood model. Where FEMA has studied the ground, the model uses FEMA's own zones; where FEMA's maps leave gaps, it estimates the zone from what FEMA drew on similar ground nearby.
This page is for current or potential residents concerned about large-scale flooding risk in Joshua. It maps flood zones street by street and shows the 30-year chance of a flood and how many buildings carry flood insurance.
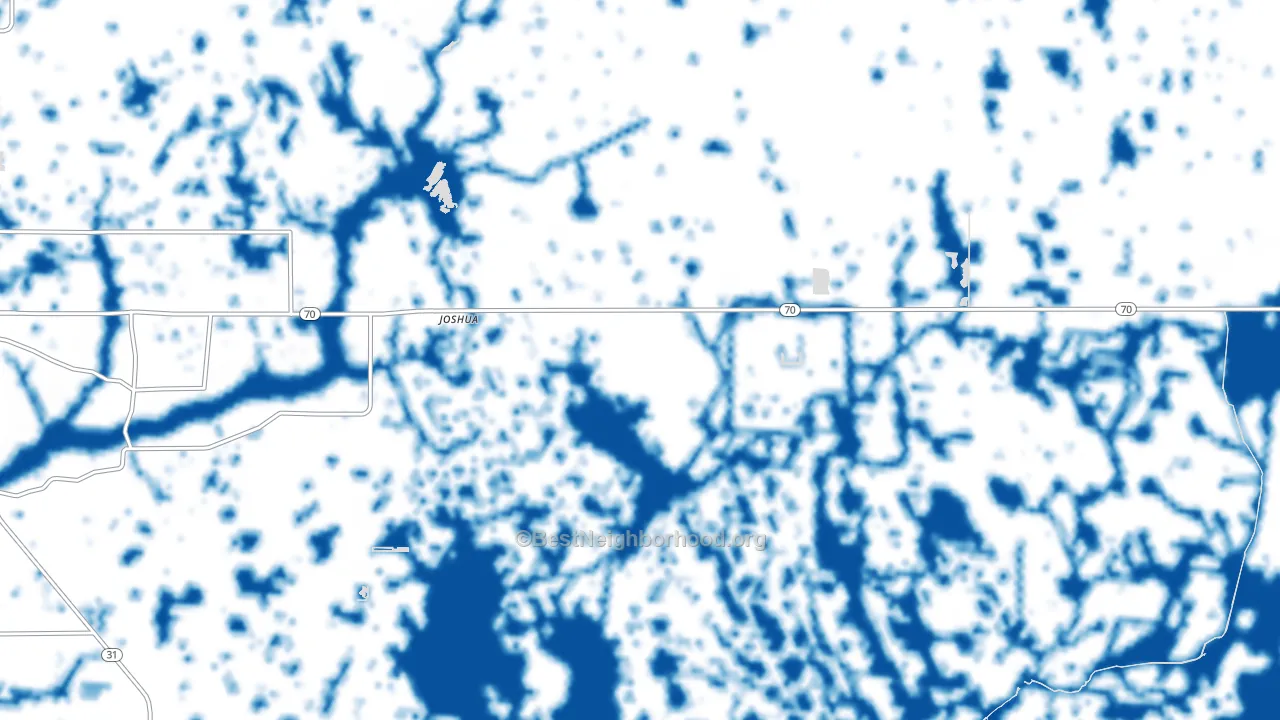
What this map counts as a flood
This map counts floods from rivers and creeks that leave their banks in Joshua.
On FEMA's scale, the high-risk zone is the 1%-a-year zone, also called the 100-year floodplain, and 65 residents of Joshua live in it. The moderate zone, where the chance is 0.2% to 1% a year, is home to 1 more.
In Joshua, these figures follow FEMA's own flood zones wherever its digital map covers the ground.
Rain that floods streets and basements in Joshua away from a waterway is outside this map.
How likely is a flood in Joshua?
For residents of Joshua in FEMA's high-risk zone, the chance of a flood is 1% or more a year: at least 1 in 4 over a 30-year mortgage. In the moderate zone of Joshua, the chance is 0.2% to 1% a year, from about 1 in 17 to 1 in 4 over 30 years.
| Flood zone | Chance in a year | Chance over 30 years | Joshua residents | Florida residents | U.S. residents |
|---|---|---|---|---|---|
| High risk: Zone A | 1% or more | about 1 in 4 or more | 3.7% | 24% | 5.6% |
| Moderate risk: Zone X (shaded) | 0.2% to 1% | about 1 in 17 to 1 in 4 | fewer than 1% | 5.3% | 4.5% |
| Minimal risk: Zone X | under 0.2% | under 1 in 17 | 96% | 65% | 83% |
What flooding looks like in Joshua
Across Joshua, FEMA's high-risk flood zone holds 3.7% of residents, about 1 in 27, or 65 people. Nationwide the share is 5.6%; across Florida, 24%.
Flood zones in Joshua
FEMA's map of Joshua shows three zones; its one lettered high-risk zone, A, holds 3.7% of residents.
| Zone | Share of residents | What it means |
|---|---|---|
| A | 3.7% | High risk, no flood heights published |
| X (shaded) | fewer than 1% | Moderate risk, the 0.2%-a-year or 500-year floodplain |
| X | 96% | Minimal risk, outside the 500-year floodplain |
Flood insurance in Joshua
In DeSoto County, 3.3% of residential buildings carry a federal flood insurance policy, about the same as the U.S. share of 2.9%. DeSoto County has about 430 such policies in force.
Standard homeowners insurance does not cover flood damage, FEMA notes.
How current is the flood map in Joshua?
Nearly every resident of Joshua lives on a FEMA flood map panel that took effect in 2013, 13 years before this page's 2026 update, the year by which half of U.S. residents' panels had taken effect.
How Joshua compares
Within 24 miles of Joshua, the share of residents in FEMA's high-risk zone runs from 7.1% in Southeast Arcadia, FL to 37% in Harbour Heights, FL, all above the 3.7% in Joshua. Among places of a similar size to Joshua, Belleair Beach, FL has the highest share, 94%, and Half Moon, FL the lowest, fewer than 1%.
Questions about flooding in Joshua
Is Joshua in a flood zone?
Parts of Joshua are: by BestNeighborhood's estimate, FEMA's high-risk flood zone holds 3.7% of its residents, 65 people, and the moderate zone fewer than 1%.
Do I need flood insurance in Joshua?
Federal law requires flood insurance on buildings in FEMA's high-risk zone in Joshua that carry a mortgage from a federally regulated or insured lender; outside that zone the law does not require it. In DeSoto County, 3.3% of residential buildings carry a federal flood policy.
How often does it flood in Joshua?
In FEMA's high-risk zone in Joshua, a flood has at least a 1 in 4 chance over a 30-year mortgage.
What does flood zone A mean? And zone X?
Zone A is high-risk ground without published flood heights, home to 3.7% of residents in Joshua. Unshaded zone X is minimal-risk ground outside the 500-year floodplain, home to 96% of residents. Shaded zone X is moderate-risk ground in the 500-year floodplain, with a 0.2% to 1% chance of flooding each year, home to fewer than 1% of residents.
How do I find the flood zone for my address in Joshua?
The map of Joshua above shows the zone street by street; zoom in to an address to read it. For the official zone that lenders and insurers use, FEMA's Flood Map Service Center at msc.fema.gov has the Flood Insurance Rate Map for Joshua.
Does this flood map include street and basement flooding from heavy rain?
No, the map of Joshua counts rivers and creeks on FEMA's scale, and rain that floods streets and basements away from a waterway is outside it.
Sources and method
BestNeighborhood's flood model reads FEMA's National Flood Hazard Layer at 10-meter detail and counts residents by 2020 Census block. Where FEMA has studied the ground, the value is FEMA's. Elsewhere the value is an estimate of what FEMA's map would show.
Claims and policies come from FEMA's National Flood Insurance Program records.
Limits
This page is not a flood determination; lenders and insurers use FEMA's Flood Insurance Rate Map.
Rain that floods streets and basements away from rivers and creeks is not counted.
The high-risk zone means a chance of 1% a year or more, and land right beside a river floods more often than that.
Each value is a mean over a small cell of ground, not a reading for one address.
Sources
Federal Emergency Management Agency (FEMA) National Flood Hazard Layer: Flood zones on the map, the share of residents in each zone and the dates of the map panels.
FEMA National Flood Insurance Program claims and policies (OpenFEMA): Paid flood claims, policies in force and their cost. This product uses FEMA's OpenFEMA API but is not endorsed by FEMA; FEMA and the federal government cannot vouch for analyses made from these data.
U.S. Census Bureau 2020 Census blocks: Where residents live, so each figure counts people rather than land.
Last updated .
More about Joshua
Coming soon: 2027 wildfire risk
A map of wildfire risk for the 2027 fire season is coming to this page for Joshua, and to BestNeighborhood for the U.S.
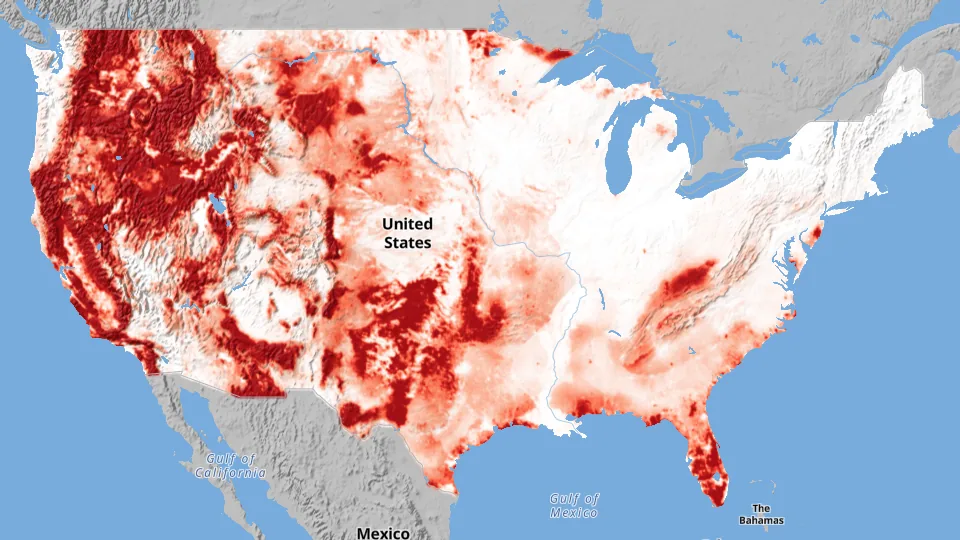
Early access is available now for businesses through paid CrimeGrade reports. Every report includes Disaster Grade Beta, with scores and maps at the report's address for each hazard listed below.
What a business report covers
- Flood
- Wildfire, this season and in a typical year
- Wind
- Tornado wind
- Earthquake
- Hail
- Heat
- Extreme cold