
This page draws on the CDC PLACES dataset to summarize the health of adults in Baker, FL. The single biggest gap vs. the national average is COPD. The share of adults living with COPD here is 25% above the U.S. average. The sections below explain that measure and compare all 40 measures with the U.S. average. The CDC PLACES 2025 release publishes 33 of its 40 measures for Baker, FL. The rest are marked as no data.
Top Health Metrics in Baker, FL
Four headline measures for adults in Baker, FL, each compared with the U.S. average. Green is better than the U.S., red is worse. In every bar the center line is the U.S. average and the dot is Baker, FL.
Local resources for Baker, FL
Data and tools from BestNeighborhood and our sister sites, all built on the same hyper-local rigor as the page you're on.
COPD in Baker, FL
8.1% of adults living with COPD · 25% above the U.S. average
Chronic obstructive pulmonary disease (COPD) is a group of lung diseases that prevent airflow to the lungs and get worse over time. Tobacco smoke is the main cause of COPD in the U.S., according to CDC.
Coronary Heart Disease in Baker, FL
7.2% of adults living with coronary heart disease · 18% above the U.S. average
Coronary heart disease, also called coronary artery disease, is the most common type of heart disease in the U.S. Heart disease is the leading cause of death in the U.S., according to CDC.
The Community Health Need Index across Baker, FL
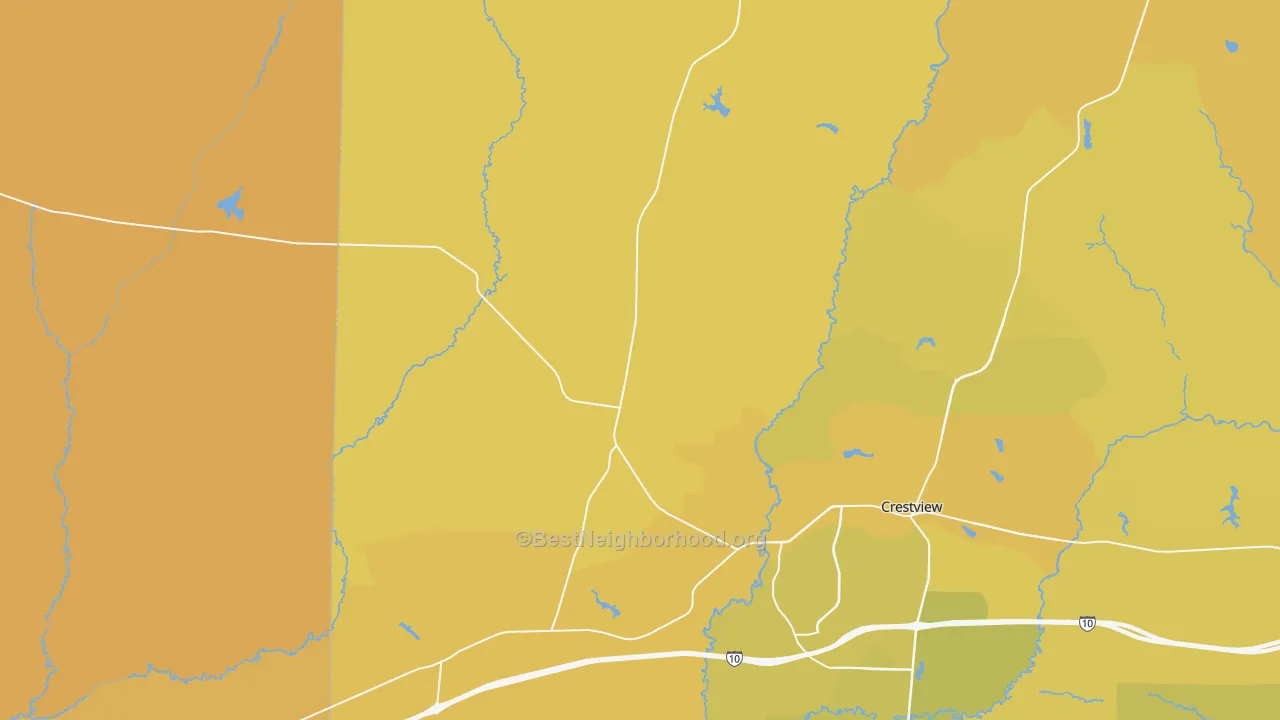
The Community Health Need Index rolls up 39 CDC PLACES measures into one value per census tract, where 50 is the U.S. average and higher means more measured health need. Switch layers to see the overall index or any of its three components.
This is not a health score or a grade. It's a Community Health Need Index (CHNI), a needs assessment that combines three parts. Current health burden covers existing disease, mental-health symptoms, and disability. Preventable risk covers factors like smoking, inactivity, obesity, and high blood pressure. Access and barriers covers the ability to reach care, food, and support. On the 0 to 100 scale, 50 is the U.S. average. The index does not predict any individual's health or offer medical advice. Read the full CHNI methodology.
All 40 CDC Community Health Measures
Every measure CDC tracks at the neighborhood level, comparing this place to the U.S. weighted average. Each value is the share of adults reporting the condition or behavior.
Long-term conditions adults live with day to day, from diabetes and heart disease to arthritis and cancer.
| Chronic Disease | Local | U.S. avg | Vs. U.S. |
|---|---|---|---|
| Diabetes Diagnosis | 11.9% | 11.9% | About average |
| High Blood Pressure | 36.0% | 33.9% | 6% worse |
| High Cholesterol | 37.0% | 36.0% | About average |
| Coronary Heart Disease | 7.2% | 6.1% | 18% worse |
| Stroke | 3.6% | 3.4% | 7% worse |
| Cancer (Non-Skin) or Melanoma | 10.0% | 7.6% | 31% worse |
| COPD | 8.1% | 6.5% | 25% worse |
| Current Asthma | 10.1% | 10.4% | About average |
| Arthritis | 29.9% | 24.9% | 20% worse |
| Obesity | 32.0% | 33.4% | About average |
| Depression | 20.5% | 21.9% | 7% better |
Everyday habits that shape future health, like smoking, drinking, physical activity, and sleep.
| Health Behaviors | Local | U.S. avg | Vs. U.S. |
|---|---|---|---|
| Adult Smoking | 15.1% | 13.1% | 15% worse |
| Binge Drinking | 16.8% | 16.1% | About average |
| Physical Inactivity | 24.3% | 25.3% | About average |
| Short Sleep Duration | 37.0% | 36.5% | About average |
Screenings and routine visits that catch problems early. Higher shares are better here.
| Preventive Care | Local | U.S. avg | Vs. U.S. |
|---|---|---|---|
| Annual Doctor Visit | 77.2% | 76.6% | About average |
| Cholesterol Screening | 86.8% | 85.8% | About average |
| Colorectal Cancer Screening | 68.8% | 63.9% | 8% better |
| Mammography Screening | 72.0% | 75.8% | About average |
| Annual Dental Visit | 59.4% | 61.3% | About average |
| Taking Blood Pressure Medication | 78.0% | 74.3% | About average |
How adults rate their own physical and mental health, plus related quality-of-life measures.
| Health Status | Local | U.S. avg | Vs. U.S. |
|---|---|---|---|
| Fair or Poor General Health | 18.5% | 20.1% | 8% better |
| Frequent Physical Distress | 14.6% | 13.5% | 9% worse |
| Frequent Mental Distress | 18.1% | 16.8% | 7% worse |
| All Teeth Lost (Adults 65+) | 15.0% | 13.2% | 14% worse |
The share of adults living with difficulty in mobility, cognition, hearing, vision, or self-care.
| Disability | Local | U.S. avg | Vs. U.S. |
|---|---|---|---|
| Any Disability | 31.9% | 30.6% | About average |
| Mobility Limitation | 14.3% | 13.9% | About average |
| Cognitive Limitation | 14.2% | 14.7% | About average |
| Hearing Limitation | 7.7% | 6.6% | 17% worse |
| Vision Limitation | 4.8% | 5.6% | 14% better |
| Self-Care Limitation | 3.7% | 4.0% | 8% better |
| Independent Living Limitation | 8.0% | 8.4% | About average |
Insurance, food, housing, transportation, and support. These conditions decide whether residents can reach care.
| Access & Social Drivers | Local | U.S. avg | Vs. U.S. |
|---|---|---|---|
| Adults Without Health Insurance | 10.0% | 11.3% | 11% better |
| Loneliness | n/a | 34.4% | No data |
| Lack of Social and Emotional Support | n/a | 24.8% | No data |
| Food Insecurity | n/a | 17.1% | No data |
| SNAP Receipt | n/a | 14.3% | No data |
| Housing Insecurity | n/a | 13.8% | No data |
| Utility Shut-Off Threat | n/a | 8.8% | No data |
| Lack of Reliable Transportation | n/a | 9.1% | No data |
Healthcare near Baker, FL
Access to good healthcare is inseparable from the metrics on this page. Below are the closest hospital and pharmacy, plus the top-rated Medicare plan available in this area. Hospital data comes from CMS Care Compare, pharmacy data from the CMS NPI Registry, and Medicare plan data from CMS Medicare Plan Finder, all aggregated by our sister site InsuranceDataNow.
Nearest Pharmacy
Health-Smart Pharmacy, 1.6 mi away
5809 Highway 189 N Baker, FL 32531
GoodRx lists prescription prices at nearby pharmacies. The GoodRx link is an affiliate link.
Top-Rated Medicare Plan
Devoted Dual Plus 042 Fl (HMO D-SNP)
CMS Star Rating: ★ 5.0 / 5.0
Star ratings reflect quality of care and member satisfaction. For ACA marketplace plans instead, see HealthSherpa.
Hospital and pharmacy details are sourced from CMS public files and refreshed when CMS publishes new data. Please call ahead to confirm hours, walk-in availability, and current insurance acceptance. Medicare star ratings reflect the most recent CMS release. Nothing on this page is medical or insurance advice.
Internet access for telehealth in Baker, FL
Reliable broadband is the backbone of telehealth. Most video visits need at least 5 Mbps down and 1 Mbps up to stay stable. In Baker, FL, 16% of addresses have fiber service available, and Centurylink has the widest local coverage. The area is served by 4 providers, with advertised speeds up to 850 Mbps.
Not sure what you have at home? Enter your address on ISP Reports to see exactly which plans are available at your door, and whether your current plan is competitive.
Check providers at your address →Provider and speed data from our sister site ISP Reports, sourced from FCC broadband maps. No cost, no signup.
Check internet providers at your address in Baker, FL
The numbers above are place-wide. To see exactly which providers and speeds are available at your home, look up your street address. Telehealth visits are most reliable on a wired connection of at least 5 Mbps down and 1 Mbps up.
Opens our sister site ISP Reports in a new tab with the providers and plans available at your exact address. Free, no signup, no paid placements. Address data is processed by Google Places and not stored by BestNeighborhood.
Community Health FAQ for Baker, FL
Where does this data come from?
Every health measure on this page comes from the U.S. Centers for Disease Control and Prevention's PLACES 2025 release, which estimates each measure for every census tract. BestNeighborhood combines the tract estimates into one figure for Baker, FL, weighting each census block by its population in American Community Survey 2024 data. Local healthcare details come from CMS public files: Care Compare for hospitals, the NPI Registry for pharmacies, and Plan Finder for Medicare Star Ratings. Internet availability comes from the FCC National Broadband Map, and the safety grade comes from FBI UCR data via CrimeGrade.org.
Which health measure stands out most in Baker, FL?
Among the measures this page spotlights, COPD compares least favorably with the U.S. average in Baker, FL. The share of adults living with COPD in Baker, FL is 8.1%, which is 25% above the U.S. average in the CDC PLACES 2025 release. Chronic obstructive pulmonary disease (COPD) is a group of lung diseases that prevent airflow to the lungs and get worse over time. Tobacco smoke is the main cause of COPD in the U.S., according to CDC. The release publishes 33 of its 40 measures for Baker, FL, so this comparison covers only those. CDC PLACES estimates show how common a measure is, not what causes it.
How current is this data?
The measures come from the CDC PLACES 2025 release. CDC builds each release from Behavioral Risk Factor Surveillance System survey answers collected one to two years before the release.
About this data and who reviewed it
Wes is a co-founder of BestNeighborhood, CrimeGrade.org, InsuranceDataNow.org, and ISPReports.org. He spent 25+ years in data analytics, including work with highly regulated genomic data at Ancestry.com, and reviews every Community Health page for source accuracy and methodology.
Sources
- CDC PLACES: Local Data for Better Health, U.S. Centers for Disease Control and Prevention. cdc.gov/places (2025 release). Used for all 40 community health measures on this page.
- U.S. Census Bureau, American Community Survey: Population and demographic estimates. census.gov (2024). Used to population-weight CDC tract values up to the city level.
- CMS Care Compare (Hospital Compare): U.S. Centers for Medicare & Medicaid Services hospital quality and location data. medicare.gov/care-compare. Source for nearest-hospital name, address, and phone.
- CMS NPI Registry (NPPES): National Plan and Provider Enumeration System. npiregistry.cms.hhs.gov. Source for nearest-pharmacy details.
- CMS Medicare Plan Finder & Star Ratings: Annual Part C and Part D plan ratings published by CMS. medicare.gov/plan-compare. Source for top-rated Medicare plan and CMS Star Rating.
- FCC National Broadband Map: Federal Communications Commission semiannual broadband availability filings. broadbandmap.fcc.gov. Source for fiber coverage, provider count, and speeds shown in the telehealth section.
- FBI Uniform Crime Reporting (UCR) and state crime reports: Source for the safety grade shown in the local resources bar; aggregated and graded by CrimeGrade.org.
- BestNeighborhood internal datasets: Block-level population estimates and place-cardinal classification used to roll CDC values up to the city level and to generate the "varies inside" callouts.
- CDC/ATSDR Environmental Justice Index (EJI): Agency for Toxic Substances and Disease Registry. atsdr.cdc.gov (2024 and 2022 releases). Fills Community Health Need Index map values where the CDC PLACES release leaves a measure blank, mainly in Pennsylvania and Kentucky. The measure tables on this page use CDC PLACES only.
Verification: Hospital, pharmacy, and Medicare plan data come from CMS public files and reflect the most recent release. Phone numbers, hours, and current insurance acceptance can change, so please call ahead to confirm. Nothing on this page is medical, legal, or insurance advice.
Affiliate disclosure: Some links on this page are affiliate links to partners we have a commercial relationship with (clearly marked with the "Affiliate" or "sponsored" tag). They never change which data we surface, only which optional resources we list. We do not accept payment to alter the CDC, CMS, FCC, or FBI data shown on this page.