Silver Swan is a Democratic stronghold. About 87% of voters here vote Democratic and 13% Republican.
[sc name="abovemapcta"]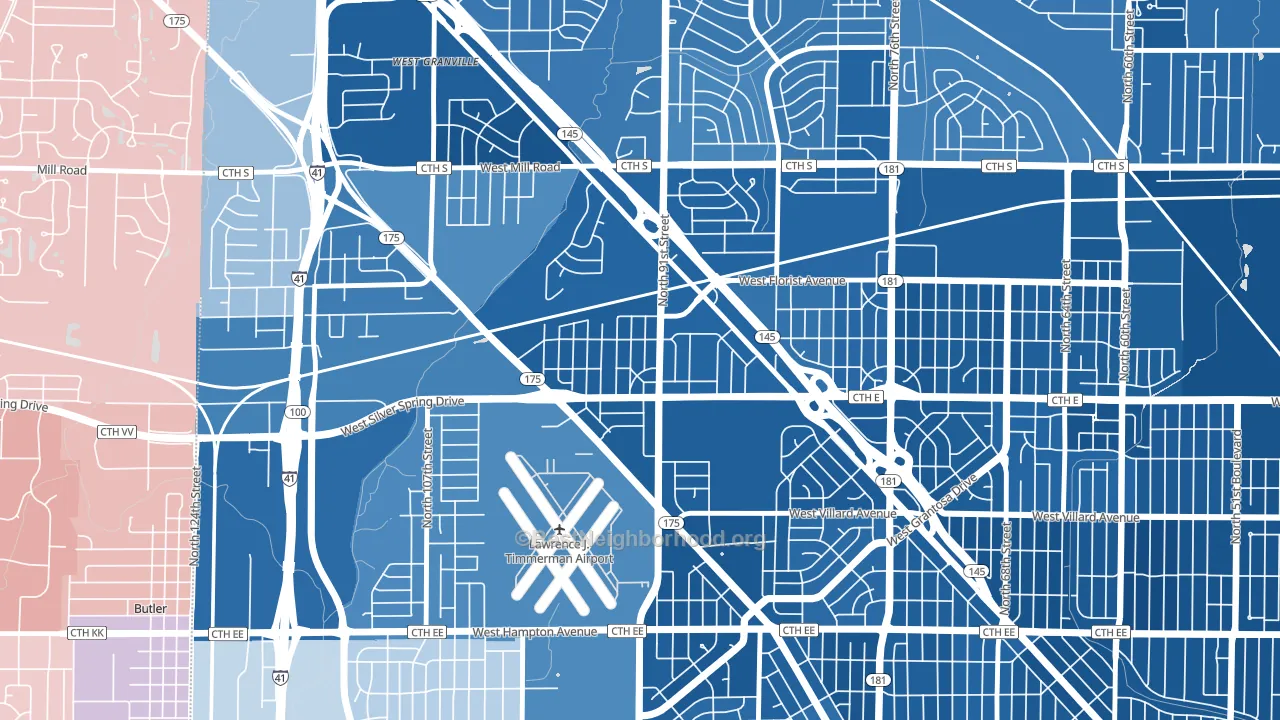 [bestneighborhood_map_controls]
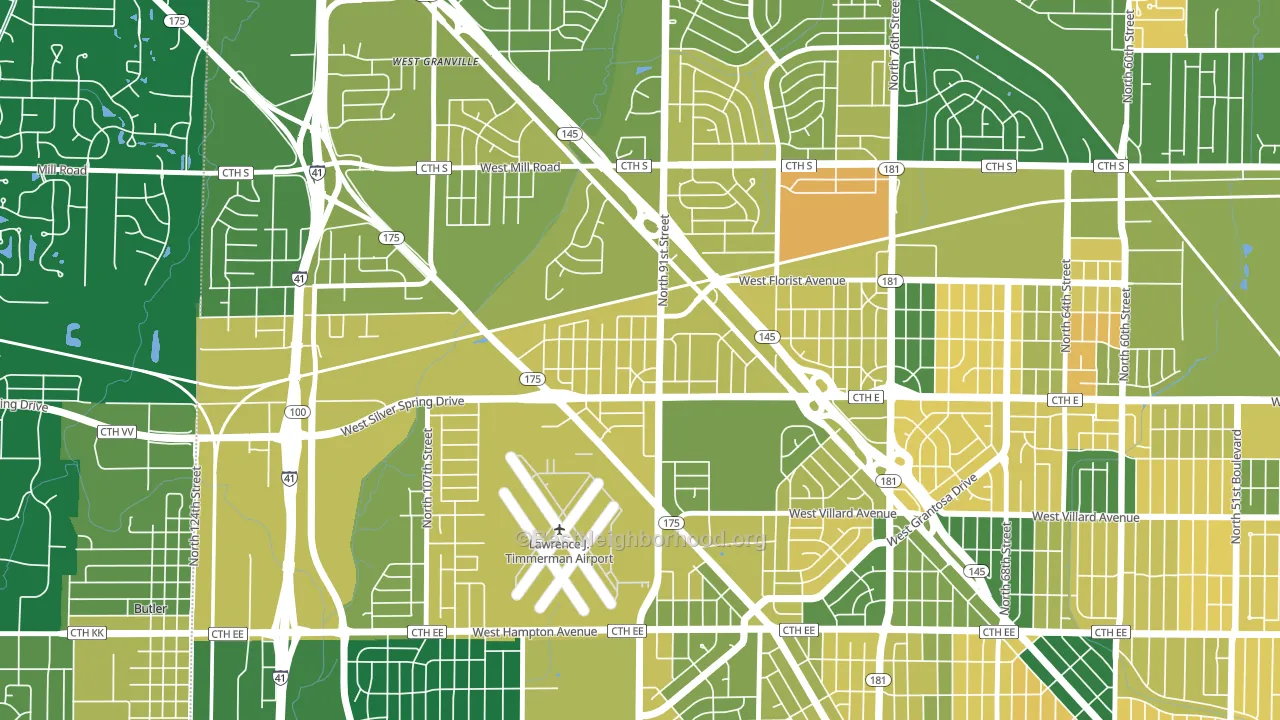
About 56% of adults in Silver Swan typically vote, below the U.S. average of about 62%. Among adults in Silver Swan, ~49% vote Democratic, ~7% Republican, and ~44% don't vote. The map below shows estimated turnout by block group.
 [bestneighborhood_map_controls]
How Silver Swan compares
Among neighborhoods within 5 miles, Silver Swan leans more Democratic than 10 of 28 neighbors.
Silver Swan runs about 74 points more Democratic than Wisconsin as a whole. Wisconsin is roughly evenly split, and Silver Swan sits clearly on the Democratic side.
Why Silver Swan leans the way it does
This analysis examined 14,881 data points per neighborhood to find what predicts political lean and turnout. The items below are a few correlations that stood out for Silver Swan, not a ranked or complete list of what matters most.
Dense areas vote Democratic. More than 99% of residents in Silver Swan live in densely developed areas, about 64 points above the U.S. average of 36%. A high never-married share predicts Democratic voting, and about 68% of adults in Silver Swan have never been married, above 97% of neighborhoods. Silver Swan runs against the grain of Wisconsin, a Democratic-leaning outlier in a roughly evenly split state.
Population density and Democratic lean
Places with high population density tend to lean Democratic; Silver Swan, Milwaukee, WI sits in the top quarter nationally on this measure.
Why turnout in Silver Swan looks the way it does
Renters vote less often than owners. About 72% of households in Silver Swan rent, about 47 points above the U.S. average of 25%. High food insecurity lines up with lower turnout, and about 38% of adults in Silver Swan report food insecurity, above 91% of neighborhoods. Learn more about the findings and methodology on the political spectrum map.
[one_half]Nearby Neighborhoods
- Valhalla, Milwaukee, WI D+79
- Menomonee River Hills, Milwaukee, WI D+63
- Timmerman West, Milwaukee, WI D+47
- Long View, Milwaukee, WI D+69
- Silver Spring, Milwaukee, WI D+74
- Lindsay Park, Milwaukee, WI D+69
- Columbus Park, Milwaukee, WI D+74
- Menomonee River Hills East, Milwaukee, WI D+63
- Capitol Heights, Milwaukee, WI D+81
- Hampton Heights, Milwaukee, WI D+82
Neighborhoods with Similar Populations
- Downtown Ashland, Ashland, OH R+32
- Stockdale Greens, Bakersfield, CA R+15
- Goodby's Creek, Jacksonville, FL R+8
- 1st Ward, Portsmouth, OH R+12
- Feasterville, Feasterville-Trevose, PA R+13
- Southeast Mill Creek, Salem, OR R+6
- Downtown Geneva, Geneva, OH R+23
- Old Redford, Detroit, MI D+83
- Argyle Park, Columbus, OH D+80
- Enderly Park, Charlotte, NC D+80
Sources and methodology
Precinct-level voting records used to fit the model come from Wisconsin Elections Commission, distributed by the Voting and Election Science Team. Demographic inputs come from the U.S. Census Bureau (ACS 5-year estimates and the 2020 Decennial Census). Health and environmental inputs come from the CDC (PLACES and the Environmental Justice Index). Land cover comes from the USGS and EPA. Election-day and lead-up weather come from PRISM 4km daily grids and the NOAA Global Historical Climatology Network. Mail-voting and election-administration patterns come from the MIT Election Lab's Survey of the Performance of American Elections. Block-group crime detail comes from CrimeGrade. Internet data and modeling support provided by ISPreports.org.
Modeling and analysis by the BestNeighborhood data science team. Full methodology and findings: political spectrum map.
Methodology reviewed by the BestNeighborhood data team. Last updated May 2026.