Downtown Geneva leans Republican by roughly 24 points: about 38% of voters vote Democratic and 62% Republican.
[sc name="abovemapcta"]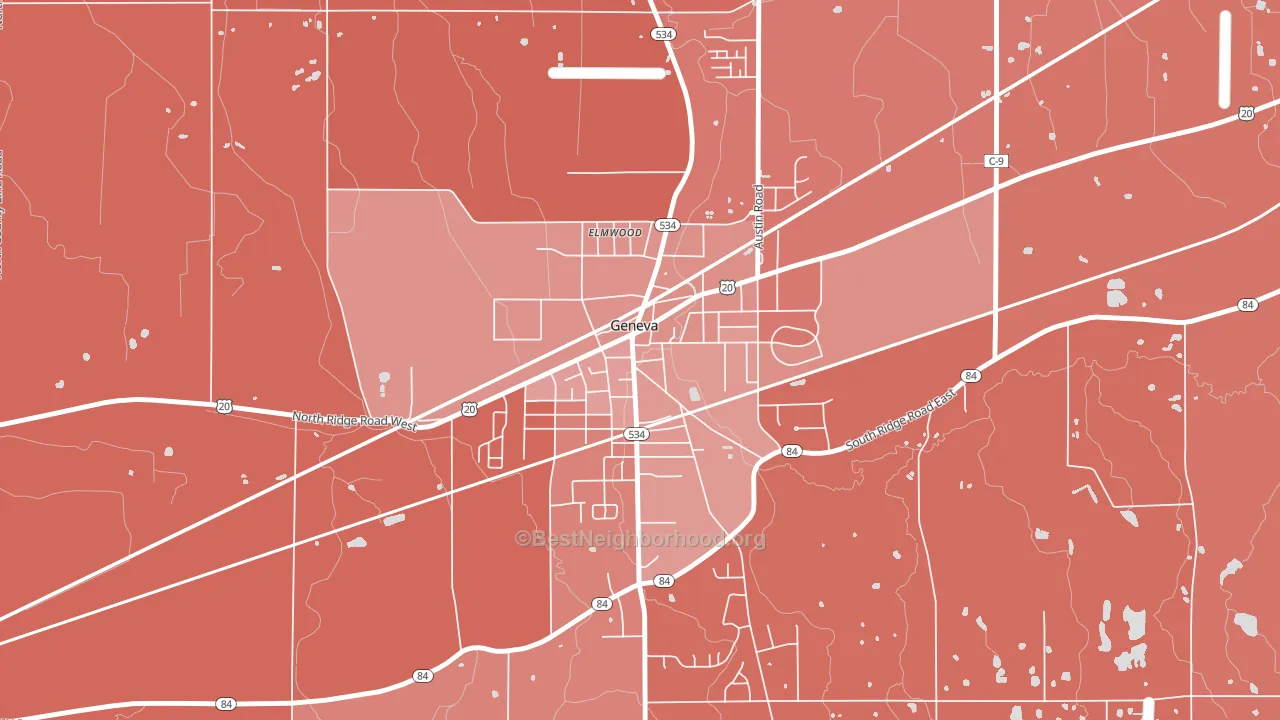 [bestneighborhood_map_controls]
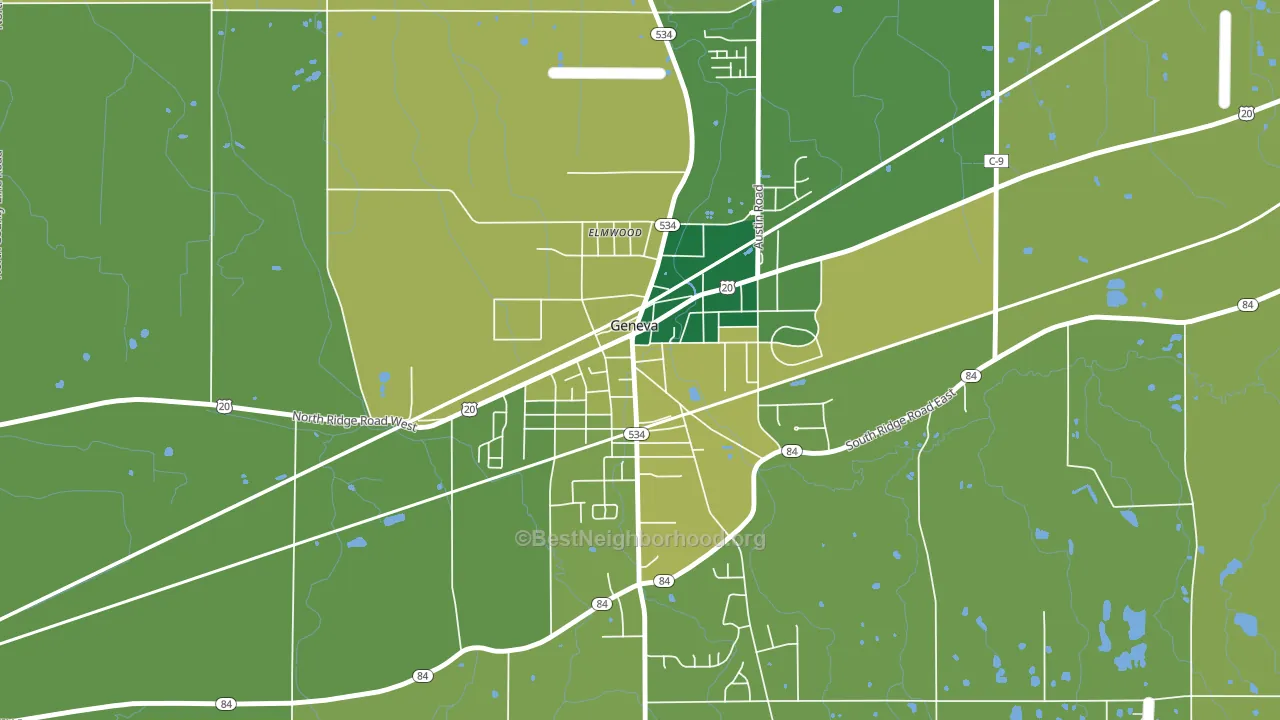
About 76% of adults in Downtown Geneva typically vote, above the U.S. average of about 62%. Among adults in Downtown Geneva, ~29% vote Democratic, ~47% Republican, and ~24% don't vote. The map below shows estimated turnout by block group.
 [bestneighborhood_map_controls]
How Downtown Geneva compares
Downtown Geneva runs about 12 points more Republican than Ohio as a whole.
Politics vary noticeably by block within Downtown Geneva. The southwest side is the most Republican-leaning (R+33) and the northwest side is the least Republican-leaning (R+19), a spread of about 15 points.
Why Downtown Geneva leans the way it does
This analysis examined 14,881 data points per neighborhood to find what predicts political lean and turnout. The items below are a few correlations that stood out for Downtown Geneva, not a ranked or complete list of what matters most.
Rural areas vote Republican, and Downtown Geneva sits in the bottom quarter on developed land relative to similar places. A high white share with below-average college attainment predicts Republican voting, and Downtown Geneva fits that profile on both counts.
Walkability and Republican lean
Places with a low walkability score tend to lean Republican; Downtown Geneva, Geneva, OH sits in the bottom quarter nationally on this measure. A walkable street grid does not change how people vote; it mostly reflects how urban a place is.
Why turnout in Downtown Geneva looks the way it does
Turnout in Downtown Geneva sits close to the national pattern. Learn more about the findings and methodology on the political spectrum map.
[one_half]Nearby Neighborhoods
- Harbor, Ashtabula, OH R+7
- Downtown Ashtabula, Ashtabula, OH Even
- Downtown Conneaut, Conneaut, OH R+19
- North Collinwood, Cleveland, OH D+71
- Euclid-Green, Cleveland, OH D+87
- South Collinwood, Cleveland, OH D+83
- Forest Hills, Cleveland, OH D+88
- Glenville, Cleveland, OH D+87
- University District, Cleveland, OH D+73
- Buckeye-Shaker, Cleveland, OH D+83
Neighborhoods with Similar Populations
- Old Redford, Detroit, MI D+83
- 1st Ward, Portsmouth, OH R+12
- Enderly Park, Charlotte, NC D+80
- Feasterville, Feasterville-Trevose, PA R+13
- Stockdale Greens, Bakersfield, CA R+15
- Central Business District-Rochester, Rochester, NY D+64
- Downtown Ashland, Ashland, OH R+32
- Lincoln, San Rafael, CA D+51
- Silver Swan, Milwaukee, WI D+74
- North River Shores, Stuart, FL R+25
Sources and methodology
Precinct-level voting records used to fit the model come from Ohio Secretary of State, Elections, distributed by the Voting and Election Science Team. Demographic inputs come from the U.S. Census Bureau (ACS 5-year estimates and the 2020 Decennial Census). Health and environmental inputs come from the CDC (PLACES and the Environmental Justice Index). Land cover comes from the USGS and EPA. Election-day and lead-up weather come from PRISM 4km daily grids and the NOAA Global Historical Climatology Network. Mail-voting and election-administration patterns come from the MIT Election Lab's Survey of the Performance of American Elections. Block-group crime detail comes from CrimeGrade. Internet data and modeling support provided by ISPreports.org.
Modeling and analysis by the BestNeighborhood data science team. Full methodology and findings: political spectrum map.
Methodology reviewed by the BestNeighborhood data team. Last updated May 2026.